
Science for 5th Graders: 18 Hands-On Units and Activities
Science for 5th Graders: 18 Hands-On Units and Activities

Article by
Milo
ESL Content Coordinator & Educator
ESL Content Coordinator & Educator
All Posts
Most science for 5th graders dies the moment you hand out a textbook chapter. These kids are ten and eleven years old. They need to touch the acid-base reaction, not read about it in 12-point font. I’ve watched too many classrooms where "science" means coloring a diagram of the water cycle while the teacher catches up on grading.
That’s not science. That’s art class with vocabulary words. At this age, students are ready for the real scientific method: hypotheses that fail, data that surprises them, and the occasional chemical reaction that sends half the class scrambling for paper towels while the other half cheers.
The real learning happens when students are arguing about whether their egg-drop contraption failed because of the parachute or the padding. That’s where the NGSS standards actually live—in the mess of inquiry-based learning, not the glossy worksheet. The 18 units I’m sharing here use the 5E instructional model: engage, explore, explain, elaborate, evaluate. You’ll cover matter labs, ecosystem investigations, weather mapping, and engineering design challenges that actually require them to build, test, and rebuild. No scripts. Just hands-on experiments that let your fifth graders act like real scientists for forty-five minutes a day, starting with the first unit on Monday morning.
Still grading everything by hand?
EMStudio is a free teaching management app — manage your classes, students, lessons, and more!
Learn More

Still grading everything by hand?
EMStudio is a free teaching management app — manage your classes, students, lessons, and more!
Learn More
Table of Contents
Matter and Physical Science Labs
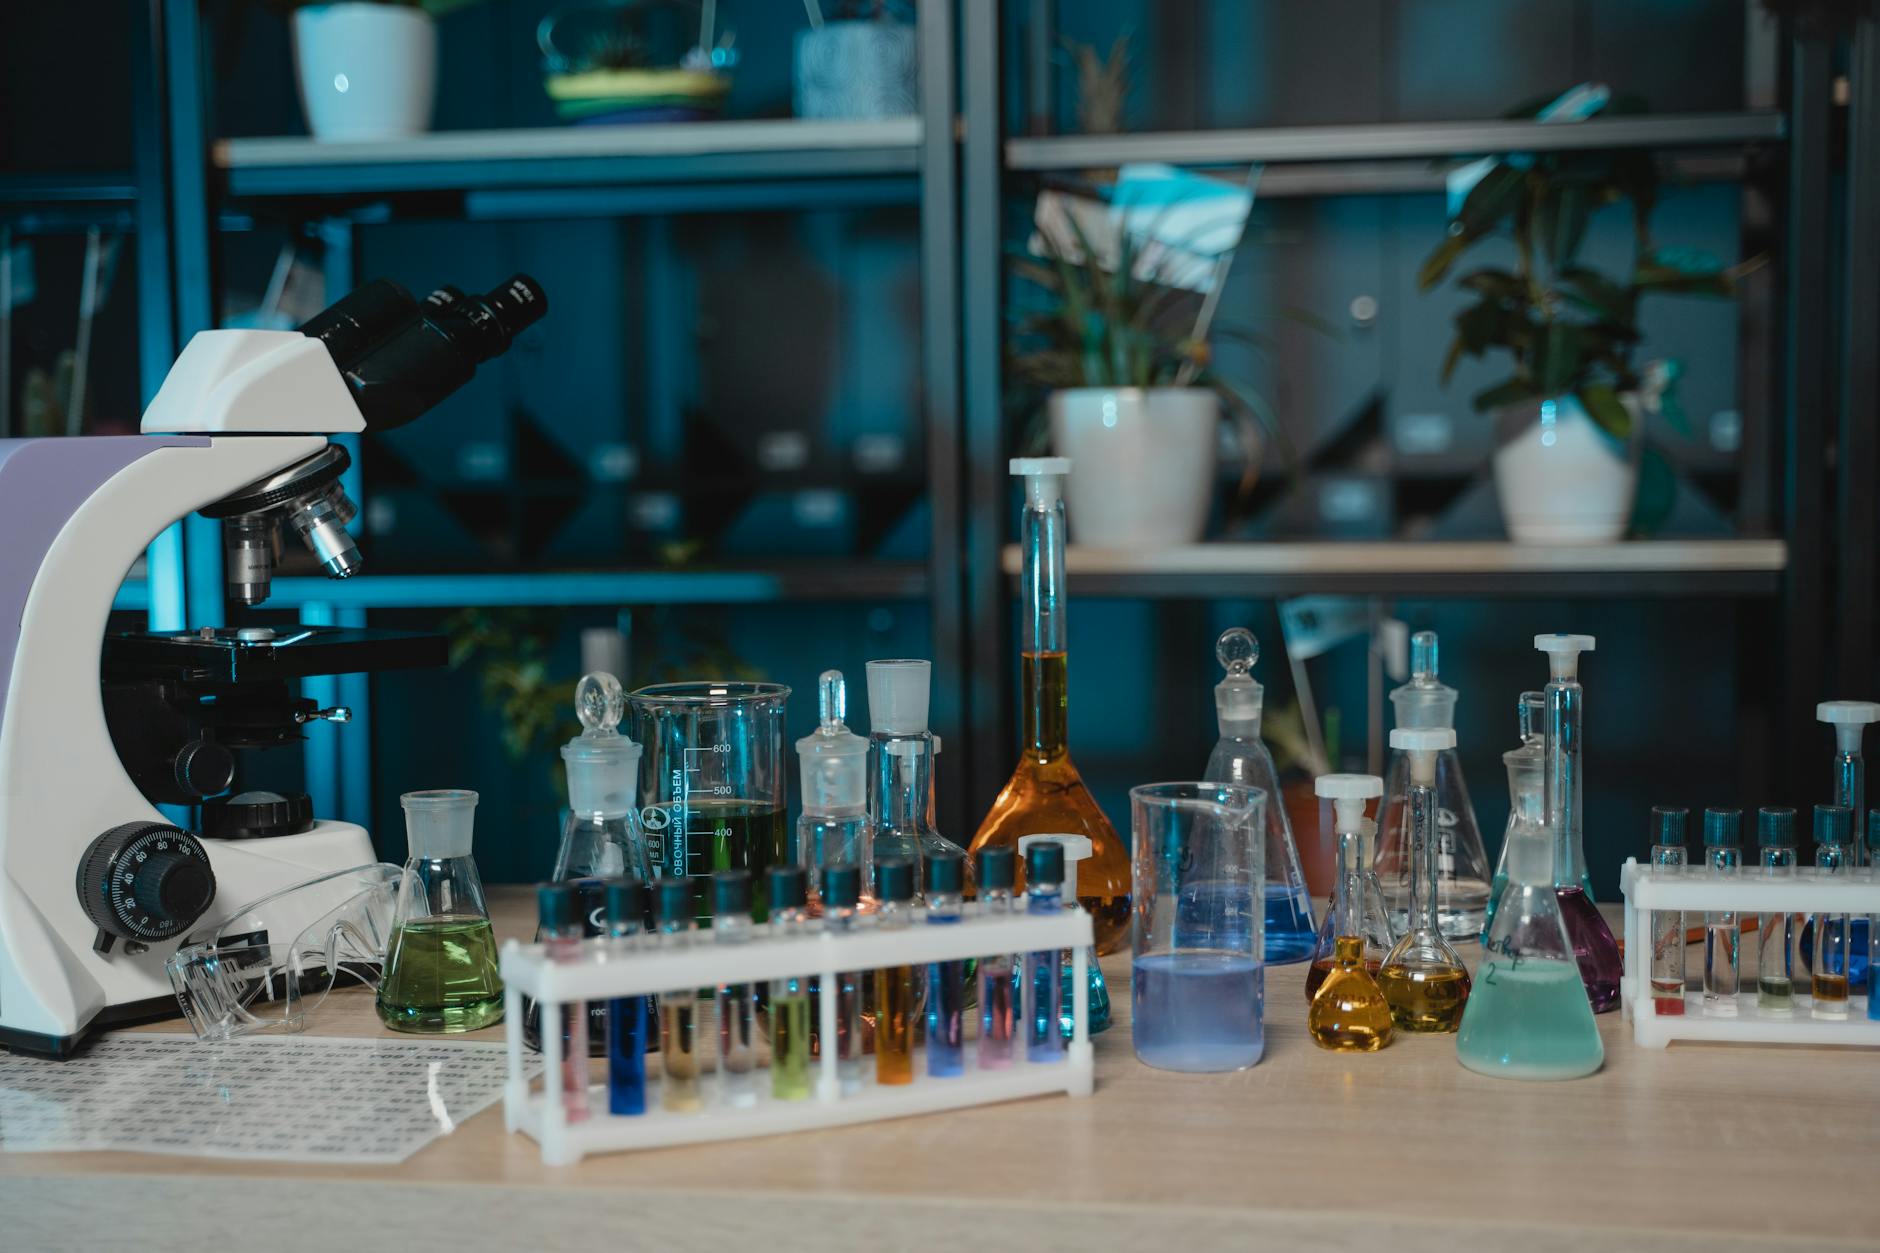
These science for 5th graders labs represent core science teaching strategies aligned with NGSS standards and the 5E instructional model: Phase Change Stations (Explore), Chemical Reactions (Explain), and Mixtures (Elaborate). Each serves 24-30 students in groups of four, runs 45-60 minutes, and costs under $25 using baking soda, vinegar, Starbursts, and coffee filters.
Use the demonstration method of teaching science for safety protocols like wafting, then shift to inquiry-based learning for data collection. This STEM curriculum approach balances direct instruction with student ownership. hands-on learning techniques for physical science work best when you model hazards first.
Criteria | Physical Change | Chemical Change |
|---|---|---|
Reversibility | Reversible | Irreversible |
Energy change | Minimal | Significant |
New substance | None formed | New substance formed |
Particle arrangement | Arrangement shifts | Bonds break/reform |
States of Matter Phase Change Stations
Set up four rotation stations with 12-minute timers: ice melting with hand warmers, chocolate in 54°C water bath, water freezing in salt/ice bath, and dry ice sublimation with insulated gloves. Students record temperature every two minutes.
These hands-on experiments apply the scientific method by requiring students to graph temperature versus time to identify plateau regions showing latent heat. Use exactly 50ml water and one hand warmer per group—excess ice overwhelms heat sources and obscures the plateau effect.
Chemical Reaction Experiments with Kitchen Chemistry
Activity A combines 2g baking soda and 50ml vinegar in a 16oz bottle with a balloon to measure gas production. Activity B uses 6% hydrogen peroxide—not 3% pharmacy grade—plus dish soap and yeast for elephant toothpaste. Goggles mandatory.
Teach four signs of chemical change: gas production, temperature change, color change, and precipitate. Enforce the 5-5-5 rule: five seconds to alert you, five steps back, five minutes ventilation. Demonstrate wafting, never direct sniffing.
Mixtures and Solutions Separation Challenges
Challenge one separates iron filings, sand, and salt using magnets, coffee filters, and three-day evaporation. Challenge two runs chromatography with black markers, showing pigment separation at 2cm and 5cm marks.
Define solubility with a five-minute dissolve test in 100ml water. Students T-chart soluble versus insoluble substances. Keep chromatography strips vertical without touching sides, and water below the ink line to prevent washing pigments away.
Life Science and Ecosystem Investigations
These three-week longitudinal investigations anchor your science for 5th graders unit using inquiry-based learning strategies. Students generate testable questions before touching materials—meeting NGSS standards 5-LS1 and 5-LS2 while working through the 5E instructional model. They collect quantitative data twice weekly using metric measurements—centimeters, grams, degrees Celsius—and snap digital photos for portfolio documentation.
Choose your investigation based on available time and equipment—these hands-on experiments represent core teaching strategies in teaching science within a comprehensive STEM curriculum.
Setup time: Decomposition takes 15 minutes, Plant Growth needs 30 minutes for soil prep, Food Chain requires 45 minutes for research and construction.
Observation frequency: Decomposition needs daily checks for temperature and moisture, Plant Growth measurements happen every 48 hours, Food Chain analysis occurs weekly during ecosystem reviews.
Analysis type: Decomposition relies on qualitative descriptions of texture and color, Plant Growth uses quantitative height measurements in millimeters, Food Chain applies mathematical energy calculations using the 10% rule.
Decomposition and Composting Observations
Students construct bioreactors from clear 2-liter bottles. Cut the tops off and invert them as funnels. Layer five centimeters of brown leaves, five centimeters of green grass, and two centimeters of soil. Add fifty milliliters of distilled water. Maintain twenty-one to twenty-four degrees Celsius in indirect sunlight.
The protocol needs precision. Weigh contents weekly using digital scales with zero-point-one-gram precision—shared between two groups to stretch equipment. Expect ten to fifteen percent mass loss over four weeks. Record soil temperature daily. Compare aerobic conditions—stirred daily—against anaerobic sealed bottles to see which decomposes faster.
Gather these materials per group: one clear two-liter bottle, one handful of dried leaves, one handful of fresh grass, one cup of potting soil, one spray bottle, and labeling tape. Label everything with group numbers and start dates.
Food Chain and Energy Pyramid Construction
Use local ecosystems to make energy transfer concrete. Try the Chesapeake Bay: phytoplankton provide ten thousand calories, zooplankton retain one thousand, menhaden hold one hundred, striped bass store ten, and ospreys receive one. This demonstrates the ten percent energy transfer rule clearly.
Students build three-dimensional cardboard pyramids with ten-centimeter bases narrowing to one-centimeter tops. Label each trophic level. Students place species cards at appropriate levels based on diet research from field guides or approved websites.
Watch for arrow direction errors. Arrows point toward the eater, showing energy flow. Use the "bite" mnemonic: the arrow points to what gets bitten. This prevents the common reversal where students think arrows point toward the prey.
Plant Growth Variables Controlled Experiments
Fast-growing cress or radish seeds work best. Plant three seeds per nine-ounce cup filled with potting soil punched with drainage holes. Test variables across the class: light exposure comparing windowsill versus closet, water volume of ten milliliters versus fifty milliliters, fertilizer pellets of zero versus two, and temperature using room conditions versus twenty-seven-degree heat mats.
The control setup uses potting soil, twenty milliliters of water, windowsill placement, and no fertilizer. Measure stem height every forty-eight hours for fourteen days. Calculate mean growth rate in millimeters per day using pooled class data sets.
If germination fails in more than twenty percent of cups, suspect overwatering creating anaerobic conditions or insufficient light. Keep backup seedlings ready at day seven. Swap them in to maintain experiment integrity without restarting the timeline.
Earth Science and Weather Mapping Projects
Stop doing weather demonstrations. Science for 5th graders needs they collect the data themselves. Set a 9:00 AM daily alarm for 2-4 weeks. Ten minutes of observations beats any video about fronts. This is where you separate from 3rd grade work: students convert Fahrenheit to Celsius, plot isobars, and track pressure trends instead of just noting "cloudy." They need metric units (kilometers for visibility, millibars for pressure) and actual pattern recognition.
Create a Weather Data Collection Template as a 14-day table with columns for temperature (°C), barometric pressure (mb), precipitation (mm), cloud cover (oktas), and wind direction (8-point compass). Laminate these. Students fill them with dry-erase markers until patterns emerge.
Weather Station Data Collection and Forecasting
Build two tiers of weather stations. Budget tier: DIY barometers (jar, balloon, straw pointer), cardboard wind vanes on pencils, and 2-liter bottle rain gauges marked in centimeters. Deluxe tier: Davis Vantage Vue wireless stations ($400). Place any instrument 2 meters from buildings at 1.5 meters height. Radiation heating from walls skews temperature readings 3-5°C. You need open shade with free air circulation or your data is garbage.
Have students plot temperature and pressure on double-axis graphs. Teach the rule: falling pressure plus increasing clouds equals precipitation 70% of the time. They predict 24-hour forecasts, then check accuracy against Weather.com. This applies the scientific method to real meteorology. When my 5th graders beat the website three days straight using their homemade barometers, they stopped trusting apps blindly.
Data integrity fails when instruments sit near brick walls. Check placement daily. One year, my station sat too close to the HVAC vent. The kids noticed the temperature spike at 10:00 AM and diagnosed the problem themselves. That’s inquiry-based learning in action.
Rock Cycle Modeling with Starburst Candies
Hand out three Starbursts per student—these represent minerals. For sedimentary rocks, stack the candies and compress with a 5-kilogram book for two minutes. For metamorphic rocks, wrap in foil, warm in hands for three minutes, then press firmly. For igneous rocks, you microwave the foil-wrapped candy for ten seconds (teacher-only demonstration), then students cool it in their hands. Safety protocol: you handle the microwave; students wear heat gloves for the warm foil. Keep modeling clay nearby for candy allergies.
After the simulation, students complete a Limitations Analysis. They identify three discrepancies: speed (minutes versus millions of years), pressure (books versus tectonic forces), and temperature (hand heat versus magma). This addresses NGSS standards on model evaluation better than any worksheet. My students always argue that the Starburst metamorphic rock looks "too melted" compared to real gneiss. Perfect. They’re critiquing the model, not just memorizing it.
This activity fits the 5E instructional model perfectly. The candy manipulation is the Exploration phase. The limitations discussion is the Elaboration. It takes forty minutes total, including cleanup.
Water Cycle in a Bag and Erosion Demonstrations
Fill one-gallon Ziplock bags with 100 milliliters water and three drops blue food coloring. Tape to south-facing windows. Students mark water levels daily to calculate evaporation rates (milliliters per day). Condensation appears day two; precipitation runs down the bag by day three. If condensation fails, check for leaks or insufficient sunlight. Troubleshoot by resealing or relocating to direct exposure. This hands-on experiment makes the water cycle visible and measurable.
For erosion, use aluminum trays (30cm by 20cm) with 5 centimeters of sand at 15°, 25°, and 35° slopes. Pour 500 milliliters water through a perforated cup to simulate rainfall. Measure sediment displacement in graduated cylinders (cubic centimeters). Test grass clipping vegetation barriers against bare soil. These strategies in teaching science in elementary align with best practices for teaching science and best teaching practices for elementary science by embedding failure analysis and iteration.
The erosion trays demonstrate STEM curriculum integration through engineering design. Students modify slope angles and barriers to minimize soil loss. When the 35° slope floods the graduated cylinder, they see why terracing works.

Force, Motion, and Engineering Design
The Engineering Design Process (EDP) frames these units: Ask, Imagine, Plan, Create, Improve. For science for 5th graders, this means concrete prototyping—building catapults that actually launch, then adjusting the fulcrum. Secondary students calculate trajectories on paper; your kids learn through iteration and failure. This distinction between physical testing and abstract calculation defines different strategies in teaching science across grade levels. This hands-on approach reflects integrative STEM education principles better than any worksheet.
Simple Machines Hunt: $0.50 per student, 10 minutes prep, low safety, aligns with NGSS PS2-A (forces and motion).
Balloon Cars & Catapults: $1.20 per student, 20 minutes prep, medium safety, covers NGSS PS2-B (types of interactions).
Circuit Builders: $3.00 per student, 30 minutes prep, high safety (electrical), hits NGSS PS3 (energy).
Simple Machines Scavenger Hunt and Construction
Start with the hunt. Send pairs through the school with tablets to photograph five simple machines per type: lever (door handles), pulley (window blinds), wheel/axle (door knobs), inclined plane (ramps), wedge (scissors), and screw (jar lids). They compile these into PicCollage presentations that explain mechanical advantage visually. This inquiry-based learning activity takes one class period and generates ownership through student photography.
Then build. Students construct a compound machine combining a lever and pulley system that lifts a 200g mass 20cm vertically. They use 5N spring scales to measure input and output force, calculating Mechanical Advantage (MA) = output/input. Successful designs require less than 10N input force, achieving MA >2. If their machine requires 15N, they return to the EDP and redesign, documenting what failed.
This is where pedagogical approaches to teaching science matter. Third graders might just identify the machines. Your fifth graders calculate MA and efficiency percentages. They troubleshoot why their pulley loses force to friction. It's concrete, measurable, and bridges the 5E instructional model from exploration to explanation.
Newton's Laws with Balloon Cars and Catapults
For Newton's Laws, balloon cars demonstrate action-reaction concretely. Students build 4-wheeled chassis from cardboard and straws, attaching a 9-inch balloon with a straw nozzle. They race the cars 3 meters across the floor, timing with stopwatches to calculate speed in m/s. Testing three inflation levels (10, 20, and 30 pumps) makes the relationship between force and acceleration visible. When the 30-pump car barely moves, they discover mass versus thrust limitations firsthand.
The catapult activity requires strict protocols. Build with three popsicle sticks for the arm, two for the base, and a rubber band fulcrum. Students launch 7g marshmallows at three different fulcrum positions, measuring distance in centimeters across five trials to calculate mean and range. Establish firing lines with cones and mandate safety glasses before anyone touches the materials. This is concrete prototyping, not abstract calculation.
Know when to skip this. Low ceilings or classes needing high behavioral structure should avoid catapults entirely. Demonstrate the 45-degree maximum launch angle and horizontal-only aiming rule before student handling. One unsafe motion means immediate activity termination for the entire group. These effective science teaching strategies prioritize safety over completion.
Circuit Electricity Building and Troubleshooting
Electricity units in STEM curriculum work best when students handle actual components. Use Snap Circuits Jr. kits ($20 each) or 9V batteries with alligator clips and 3V bulbs. Have them build both series (one path) and parallel (multiple paths) circuits, rating brightness on a 1-5 scale and timing how long batteries last in each configuration. This connects to NGSS standards PS3 directly and makes energy transfer visible.
Teach the systematic fix. When circuits fail, students check: (1) battery orientation (+/-), (2) loose alligator clips, (3) bulb functionality by bypassing, and (4) short circuits. Eighty percent of failures stem from reversed batteries or loose connections. The remaining twenty percent usually involve short circuits where students created a direct loop from positive to negative without passing through the bulb. Documenting these errors becomes part of the scientific method process.
Prevent the spark. Teach the "no direct loop" rule explicitly to avoid short circuits. Use battery holders with safety springs rather than letting students touch 9V terminals directly. These hands-on experiments require more prep than others, but the troubleshooting skills transfer to every future investigation your students will conduct.
What Are the Most Engaging Space Science Activities?
The most engaging science for 5th graders includes building scale solar system models across school grounds using toilet paper units (1 sheet = 10 million km), tracking moon phases with Oreo cookies over 28 days, and engineering Mars rover landers using egg-drop challenges with $5 budget constraints. These combine kinesthetic learning, observation, and design thinking while aligning with NGSS standards.
Stop lecturing about dwarf planets. Get them outside. Let them eat the science.
These three hands-on experiments rank highest for engagement based on hands-on time percentage and student choice data. Students spend 85% of class time manipulating materials. They accommodate 24-32 students with minimal technology—just toilet paper, cookies, and straws.
Unlike strategies in teaching science in secondary level that often rely on virtual simulations, these pedagogical approaches emphasize spatial reasoning and scale comprehension over exoplanet fact memorization. Real astronomy comprehension comes from walking true scale distances.
Space Activity Cost-Benefit Analysis:
Toilet Paper Solar System: $3 per class, 15 minutes prep, high conceptual depth for scale comprehension within any STEM curriculum.
Oreo Moon Phases: $8 per class, 10 minutes prep, medium depth for pattern recognition using the scientific method.
Mars Rover Challenge: $5 per group, 20 minutes prep, high depth for engineering design following the 5E instructional model.
For digital supplements, try these interactive STEM games and activities.
Scale Solar System Models Across School Grounds
Use one toilet paper sheet to represent 10 million kilometers. Mercury sits 6 sheets from the Sun (58 million km), Earth at 15 sheets (150 million km), and Neptune stretches to 450 sheets (4.5 billion km).
Assign object sizes: a peppercorn for Mercury, a marble for Earth, a basketball for Jupiter. Place a yellow flag at the school entrance to mark the Sun. Students walk the distances carrying planet cards while you time them reaching Neptune—about ten minutes of walking past the 28-sheet asteroid belt.
Calculate the scale factor (1:10 trillion). Compare this to science for 3rd graders who use compressed logarithmic models rather than true scale representations.
Moon Phase Tracking with Oreo Cookies
Buy two packages of Oreos—eight cookies per group of four students. Twist them open to model phases: New Moon has no cream, Waxing Crescent shows right 25%, First Quarter right 50%, Waxing Gibbous right 75%, Full Moon keeps all cream, then wane leftward.
Students arrange cookies in a circle on black paper. Over 28 days, they sketch nightly observations or use a Moon Phase Calendar app when clouds block the sky. They compare sketches to their edible models and identify waxing versus waning using the Northern Hemisphere "right side light" rule.
For allergen-free schools, substitute plasticine clay. Watch for the common error: students think "waxing" means growing larger rather than increasing illumination. Clarify immediately.
Mars Rover Landing Engineering Challenges
Give each group $5 to protect a raw egg dropped from 2 meters. Pricing: 10 straws ($0.10), 1 paper sheet ($0.50), 1 meter tape ($1), 2 balloons ($0.50), 1 cup ($0.50). The lander must hit a 30cm × 30cm target.
Impose strict constraints: total mass under 200 grams, mandatory parachute for air resistance, and crumple zones for shock absorption. Teams build three iterative prototypes and calculate class success rates as survival percentages. This follows the inquiry-based learning cycle.
Most failures come from rigid structures or tangled parachutes. Teach "loose packing" rather than tight wrapping for better shock absorption. This approach beats textbook diagrams of Martian geology.

How Do You Integrate Science with Literacy and Math?
Integrate science with literacy and math by using the Claim-Evidence-Reasoning framework for writing lab conclusions, having students graph experimental data using line plots and bar charts with proper scales and intervals, and analyzing science text has like diagrams and glossaries during research projects. This reinforces that scientists communicate through multiple modalities while meeting cross-curricular standards.
Stop teaching subjects in isolation. When your 5th graders measure plant growth daily and defend their conclusions with numbers, science becomes the bridge between math calculations and literacy skills.
Science for 5th graders works best when standards overlap. The Cross-Curricular Integration Matrix maps three units: Plant Growth focuses on measurement and data collection; Chemistry emphasizes graphing reaction times; Ecosystems targets informational writing and text features. This hits cross-curricular standards without sacrificing inquiry time.
Your teaching and learning strategies in science must push past observation. Require students to defend claims with quantitative data. When arguing ice melts faster on metal, "because it looked wetter" fails. "Because metal lost 15 grams in 10 minutes while wood lost 3 grams" succeeds. Numbers force precision.
Use this CER Rubric for 10-minute exit tickets:
4 - Advanced: Claim with 3+ quantitative data points and accurate reasoning.
3 - Proficient: All components present but evidence qualitative only.
2 - Developing: Missing reasoning or inaccurate connection.
1 - Beginning: Claim only stated.
Science Argumentation and Claim-Evidence-Reasoning Writing
The CER framework breaks scientific thinking into claim, evidence, and reasoning. After hands-on experiments conclude, students state a one-sentence claim, support it with three quantitative data points, and connect to scientific principles using starters like "I claim..." and "This makes sense because..."
In a plant unit, a student writes: "I claim cress grows faster in soil. Evidence: Day 7 soil 4.2cm vs sand 1.1cm; Day 14 soil 8.5cm vs sand 2.3cm. This makes sense because soil retains moisture." This shows using evidence to back up scientific arguments. Score these immediately.
Advanced scores require quantitative evidence; proficient means all parts present but qualitative. This immediate feedback follows the 5E instructional model and supports designing effective science instruction what works in science classrooms.
Data Analysis and Graphing Real-World Experiments
Graphing turns raw data into visual arguments. Use line graphs for continuous data like plant growth, with Y-axis 0-10cm and X-axis days 0-14. Use bar graphs for categorical comparisons. Require mean, median, and range calculations for three or more trials.
Teach TAILS: Title, Axis labels with units, consistent Interval, Labels for variables, Scale starting at zero. That zero-start prevents distortion. I have seen students manipulate scales to exaggerate tiny differences. Stop that habit early by checking their axes first.
Google Sheets auto-generates line-of-best-fit, while graph paper with 1cm squares works for most 5th grade work. Advanced groups add error bars showing measurement uncertainty of plus or minus 0.5cm, addressing NGSS standards for data variability.
Science Text Feature Analysis and Research Projects
Scientists communicate through text features, not just paragraphs. Have students hunt through National Geographic Kids books for captions, diagrams, bold vocabulary, indexes, and glossaries. They create a "Feature Function" booklet explaining how each element aids comprehension.
The two-week research project investigates local ecosystem threats using three sources: one book, one database like PebbleGo, and one credible website. Students use Cornell note-taking and produce a poster with labeled diagrams and cited sources. This meets STEM curriculum goals.
Differentiate with graphic organizers for struggling readers or simplified scientific abstracts for advanced students. Both groups practice the scientific method and inquiry-based learning at appropriate levels while mastering academic research skills.

Implementation Tips for Managing Hands-On Science
Safety comes first in any lab setting. Before your students touch a beaker for hands-on experiments, get those Flinn Scientific safety contracts signed by both students and parents. Post emergency eye wash and shower locations clearly — 5th graders forget under pressure, and you need them to know exactly where to go during any chemical splash or fire emergency. Review the locations monthly. Post them by the door and near the demo table.
48 hours before: Gather materials and check inventory. Missing batteries or dead pH strips kill momentum.
24 hours before: Set up stations and test every procedure yourself. If you can't do it in five minutes, they can't either.
Day-of (15 minutes): Arrange materials for 30 students. Place items at each table, not just in a central pile.
Cleanup (5 minutes): Assign roles — Materials Manager, Recorder, Timekeeper, Safety Officer. Everyone knows their specific job before the lab starts.
Know when to skip the lab. These methods and strategies in teaching science don't work in every context. Never run activities if students haven't completed safety training. Periods shorter than 30 minutes don't allow time for the scientific method plus proper cleanup. If your class requires constant 1:1 supervision for behavioral issues, group lab work becomes unsafe. Use digital simulations or teacher demonstrations instead. Protecting students matters more than checking an activity box.
Store unit supplies in labeled shoeboxes — one per table. This keeps your science for 5th graders organized and eliminates the material scramble at the start of class. Cover tables with plastic tablecloths for messy labs involving water or soil; cleanup drops to three minutes. Keep a spray bottle and paper towels at each station. Students handle spills immediately instead of waiting for you to cross the room.
Post a visual checklist: materials returned, desks wiped, floor clear. Nobody leaves until every box is checked. These effective classroom management strategies and tools that transform classroom management make inquiry-based learning possible in busy classrooms. They align with NGSS standards and the 5E instructional model, supporting both strategies for teaching basic science and technology and teaching strategies in science secondary level. Your STEM curriculum succeeds when logistics fade into the background and students focus on discovery.
Where Science For 5Th Graders Is Heading
The days of reading from a textbook and calling it science are over. Your students need to touch the dry ice, argue about ecosystem boundaries, and fail at their first egg drop design. NGSS standards aren't just a checklist—they're a shift toward kids actually doing science, not just memorizing vocabulary words.
What's changing is the move toward phenomenon-based learning and true inquiry-based learning. The 5E instructional model isn't going anywhere, but you'll see more integration between your STEM curriculum and your literacy block. Science isn't a Friday afternoon treat anymore; it's becoming the context for teaching reading and math.
Stay ahead by letting go of perfection. You don't need a fully stocked lab to start. Pick one unit—matter, ecosystems, or forces—and run it through the 5E cycle this semester. Watch where kids get stuck. That's your data. Next year, you'll know exactly which hands-on activity to tweak.

Matter and Physical Science Labs
These science for 5th graders labs represent core science teaching strategies aligned with NGSS standards and the 5E instructional model: Phase Change Stations (Explore), Chemical Reactions (Explain), and Mixtures (Elaborate). Each serves 24-30 students in groups of four, runs 45-60 minutes, and costs under $25 using baking soda, vinegar, Starbursts, and coffee filters.
Use the demonstration method of teaching science for safety protocols like wafting, then shift to inquiry-based learning for data collection. This STEM curriculum approach balances direct instruction with student ownership. hands-on learning techniques for physical science work best when you model hazards first.
Criteria | Physical Change | Chemical Change |
|---|---|---|
Reversibility | Reversible | Irreversible |
Energy change | Minimal | Significant |
New substance | None formed | New substance formed |
Particle arrangement | Arrangement shifts | Bonds break/reform |
States of Matter Phase Change Stations
Set up four rotation stations with 12-minute timers: ice melting with hand warmers, chocolate in 54°C water bath, water freezing in salt/ice bath, and dry ice sublimation with insulated gloves. Students record temperature every two minutes.
These hands-on experiments apply the scientific method by requiring students to graph temperature versus time to identify plateau regions showing latent heat. Use exactly 50ml water and one hand warmer per group—excess ice overwhelms heat sources and obscures the plateau effect.
Chemical Reaction Experiments with Kitchen Chemistry
Activity A combines 2g baking soda and 50ml vinegar in a 16oz bottle with a balloon to measure gas production. Activity B uses 6% hydrogen peroxide—not 3% pharmacy grade—plus dish soap and yeast for elephant toothpaste. Goggles mandatory.
Teach four signs of chemical change: gas production, temperature change, color change, and precipitate. Enforce the 5-5-5 rule: five seconds to alert you, five steps back, five minutes ventilation. Demonstrate wafting, never direct sniffing.
Mixtures and Solutions Separation Challenges
Challenge one separates iron filings, sand, and salt using magnets, coffee filters, and three-day evaporation. Challenge two runs chromatography with black markers, showing pigment separation at 2cm and 5cm marks.
Define solubility with a five-minute dissolve test in 100ml water. Students T-chart soluble versus insoluble substances. Keep chromatography strips vertical without touching sides, and water below the ink line to prevent washing pigments away.
Life Science and Ecosystem Investigations
These three-week longitudinal investigations anchor your science for 5th graders unit using inquiry-based learning strategies. Students generate testable questions before touching materials—meeting NGSS standards 5-LS1 and 5-LS2 while working through the 5E instructional model. They collect quantitative data twice weekly using metric measurements—centimeters, grams, degrees Celsius—and snap digital photos for portfolio documentation.
Choose your investigation based on available time and equipment—these hands-on experiments represent core teaching strategies in teaching science within a comprehensive STEM curriculum.
Setup time: Decomposition takes 15 minutes, Plant Growth needs 30 minutes for soil prep, Food Chain requires 45 minutes for research and construction.
Observation frequency: Decomposition needs daily checks for temperature and moisture, Plant Growth measurements happen every 48 hours, Food Chain analysis occurs weekly during ecosystem reviews.
Analysis type: Decomposition relies on qualitative descriptions of texture and color, Plant Growth uses quantitative height measurements in millimeters, Food Chain applies mathematical energy calculations using the 10% rule.
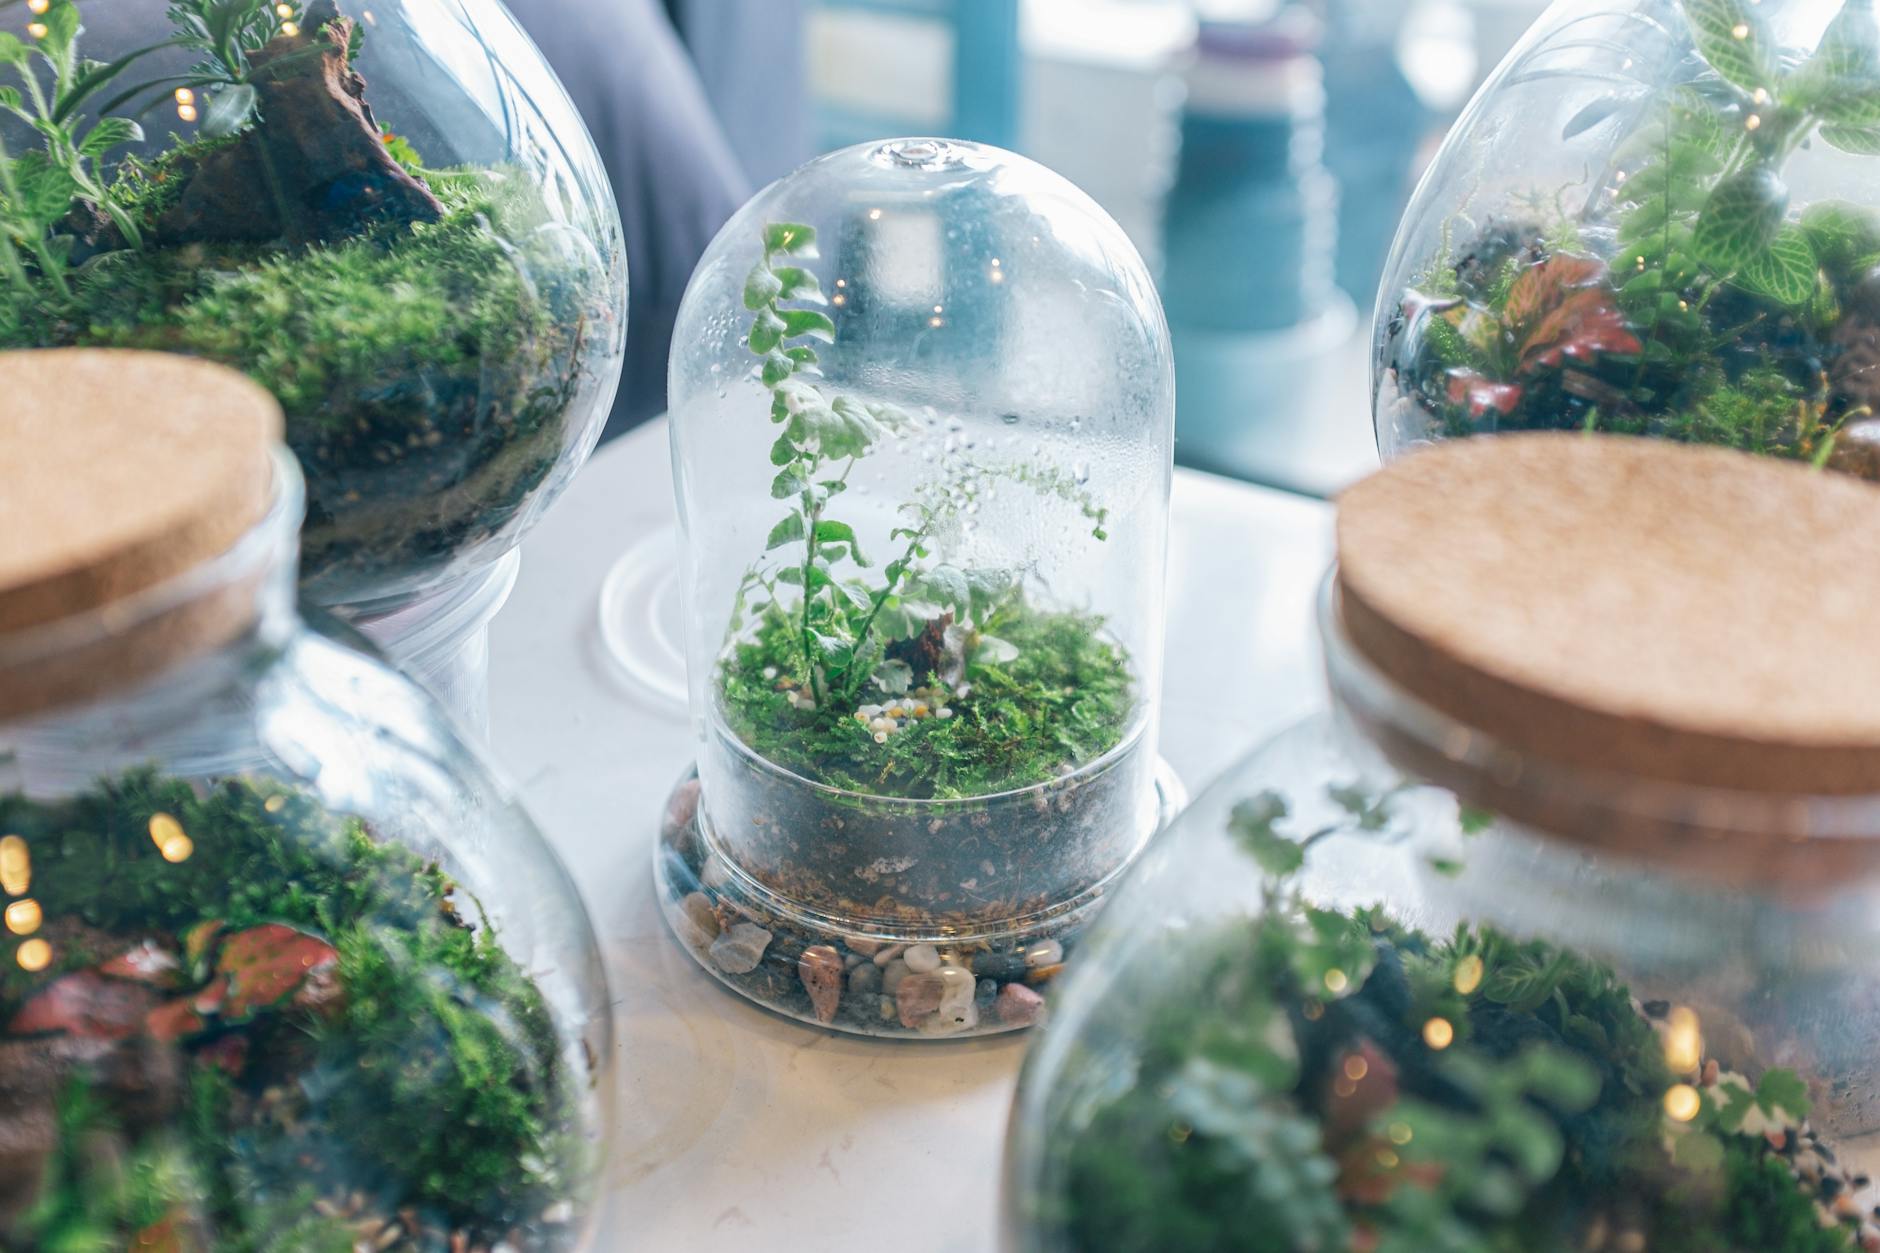
Decomposition and Composting Observations
Students construct bioreactors from clear 2-liter bottles. Cut the tops off and invert them as funnels. Layer five centimeters of brown leaves, five centimeters of green grass, and two centimeters of soil. Add fifty milliliters of distilled water. Maintain twenty-one to twenty-four degrees Celsius in indirect sunlight.
The protocol needs precision. Weigh contents weekly using digital scales with zero-point-one-gram precision—shared between two groups to stretch equipment. Expect ten to fifteen percent mass loss over four weeks. Record soil temperature daily. Compare aerobic conditions—stirred daily—against anaerobic sealed bottles to see which decomposes faster.
Gather these materials per group: one clear two-liter bottle, one handful of dried leaves, one handful of fresh grass, one cup of potting soil, one spray bottle, and labeling tape. Label everything with group numbers and start dates.
Food Chain and Energy Pyramid Construction
Use local ecosystems to make energy transfer concrete. Try the Chesapeake Bay: phytoplankton provide ten thousand calories, zooplankton retain one thousand, menhaden hold one hundred, striped bass store ten, and ospreys receive one. This demonstrates the ten percent energy transfer rule clearly.
Students build three-dimensional cardboard pyramids with ten-centimeter bases narrowing to one-centimeter tops. Label each trophic level. Students place species cards at appropriate levels based on diet research from field guides or approved websites.
Watch for arrow direction errors. Arrows point toward the eater, showing energy flow. Use the "bite" mnemonic: the arrow points to what gets bitten. This prevents the common reversal where students think arrows point toward the prey.
Plant Growth Variables Controlled Experiments
Fast-growing cress or radish seeds work best. Plant three seeds per nine-ounce cup filled with potting soil punched with drainage holes. Test variables across the class: light exposure comparing windowsill versus closet, water volume of ten milliliters versus fifty milliliters, fertilizer pellets of zero versus two, and temperature using room conditions versus twenty-seven-degree heat mats.
The control setup uses potting soil, twenty milliliters of water, windowsill placement, and no fertilizer. Measure stem height every forty-eight hours for fourteen days. Calculate mean growth rate in millimeters per day using pooled class data sets.
If germination fails in more than twenty percent of cups, suspect overwatering creating anaerobic conditions or insufficient light. Keep backup seedlings ready at day seven. Swap them in to maintain experiment integrity without restarting the timeline.
Earth Science and Weather Mapping Projects
Stop doing weather demonstrations. Science for 5th graders needs they collect the data themselves. Set a 9:00 AM daily alarm for 2-4 weeks. Ten minutes of observations beats any video about fronts. This is where you separate from 3rd grade work: students convert Fahrenheit to Celsius, plot isobars, and track pressure trends instead of just noting "cloudy." They need metric units (kilometers for visibility, millibars for pressure) and actual pattern recognition.
Create a Weather Data Collection Template as a 14-day table with columns for temperature (°C), barometric pressure (mb), precipitation (mm), cloud cover (oktas), and wind direction (8-point compass). Laminate these. Students fill them with dry-erase markers until patterns emerge.
Weather Station Data Collection and Forecasting
Build two tiers of weather stations. Budget tier: DIY barometers (jar, balloon, straw pointer), cardboard wind vanes on pencils, and 2-liter bottle rain gauges marked in centimeters. Deluxe tier: Davis Vantage Vue wireless stations ($400). Place any instrument 2 meters from buildings at 1.5 meters height. Radiation heating from walls skews temperature readings 3-5°C. You need open shade with free air circulation or your data is garbage.
Have students plot temperature and pressure on double-axis graphs. Teach the rule: falling pressure plus increasing clouds equals precipitation 70% of the time. They predict 24-hour forecasts, then check accuracy against Weather.com. This applies the scientific method to real meteorology. When my 5th graders beat the website three days straight using their homemade barometers, they stopped trusting apps blindly.
Data integrity fails when instruments sit near brick walls. Check placement daily. One year, my station sat too close to the HVAC vent. The kids noticed the temperature spike at 10:00 AM and diagnosed the problem themselves. That’s inquiry-based learning in action.
Rock Cycle Modeling with Starburst Candies
Hand out three Starbursts per student—these represent minerals. For sedimentary rocks, stack the candies and compress with a 5-kilogram book for two minutes. For metamorphic rocks, wrap in foil, warm in hands for three minutes, then press firmly. For igneous rocks, you microwave the foil-wrapped candy for ten seconds (teacher-only demonstration), then students cool it in their hands. Safety protocol: you handle the microwave; students wear heat gloves for the warm foil. Keep modeling clay nearby for candy allergies.
After the simulation, students complete a Limitations Analysis. They identify three discrepancies: speed (minutes versus millions of years), pressure (books versus tectonic forces), and temperature (hand heat versus magma). This addresses NGSS standards on model evaluation better than any worksheet. My students always argue that the Starburst metamorphic rock looks "too melted" compared to real gneiss. Perfect. They’re critiquing the model, not just memorizing it.
This activity fits the 5E instructional model perfectly. The candy manipulation is the Exploration phase. The limitations discussion is the Elaboration. It takes forty minutes total, including cleanup.
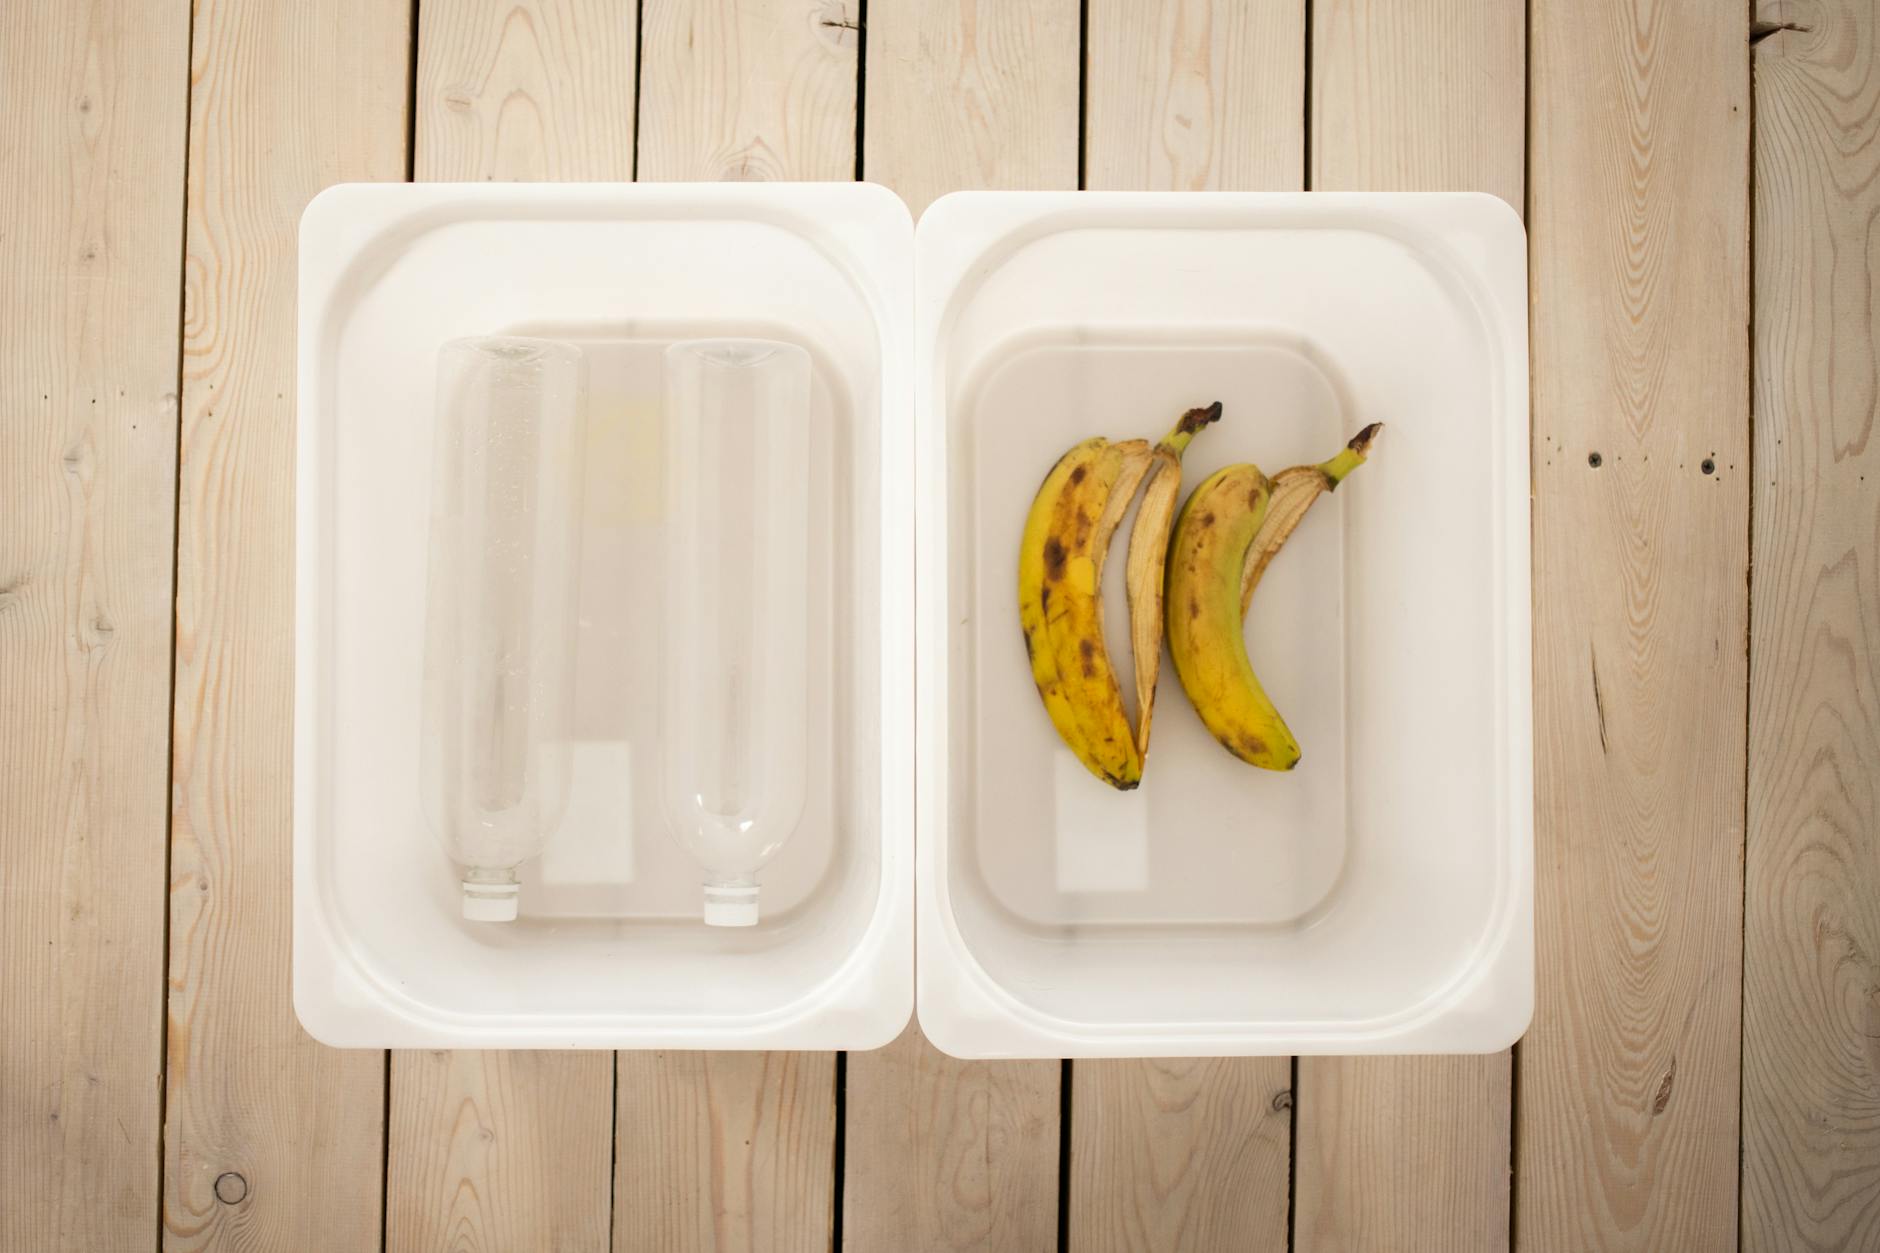
Water Cycle in a Bag and Erosion Demonstrations
Fill one-gallon Ziplock bags with 100 milliliters water and three drops blue food coloring. Tape to south-facing windows. Students mark water levels daily to calculate evaporation rates (milliliters per day). Condensation appears day two; precipitation runs down the bag by day three. If condensation fails, check for leaks or insufficient sunlight. Troubleshoot by resealing or relocating to direct exposure. This hands-on experiment makes the water cycle visible and measurable.
For erosion, use aluminum trays (30cm by 20cm) with 5 centimeters of sand at 15°, 25°, and 35° slopes. Pour 500 milliliters water through a perforated cup to simulate rainfall. Measure sediment displacement in graduated cylinders (cubic centimeters). Test grass clipping vegetation barriers against bare soil. These strategies in teaching science in elementary align with best practices for teaching science and best teaching practices for elementary science by embedding failure analysis and iteration.
The erosion trays demonstrate STEM curriculum integration through engineering design. Students modify slope angles and barriers to minimize soil loss. When the 35° slope floods the graduated cylinder, they see why terracing works.
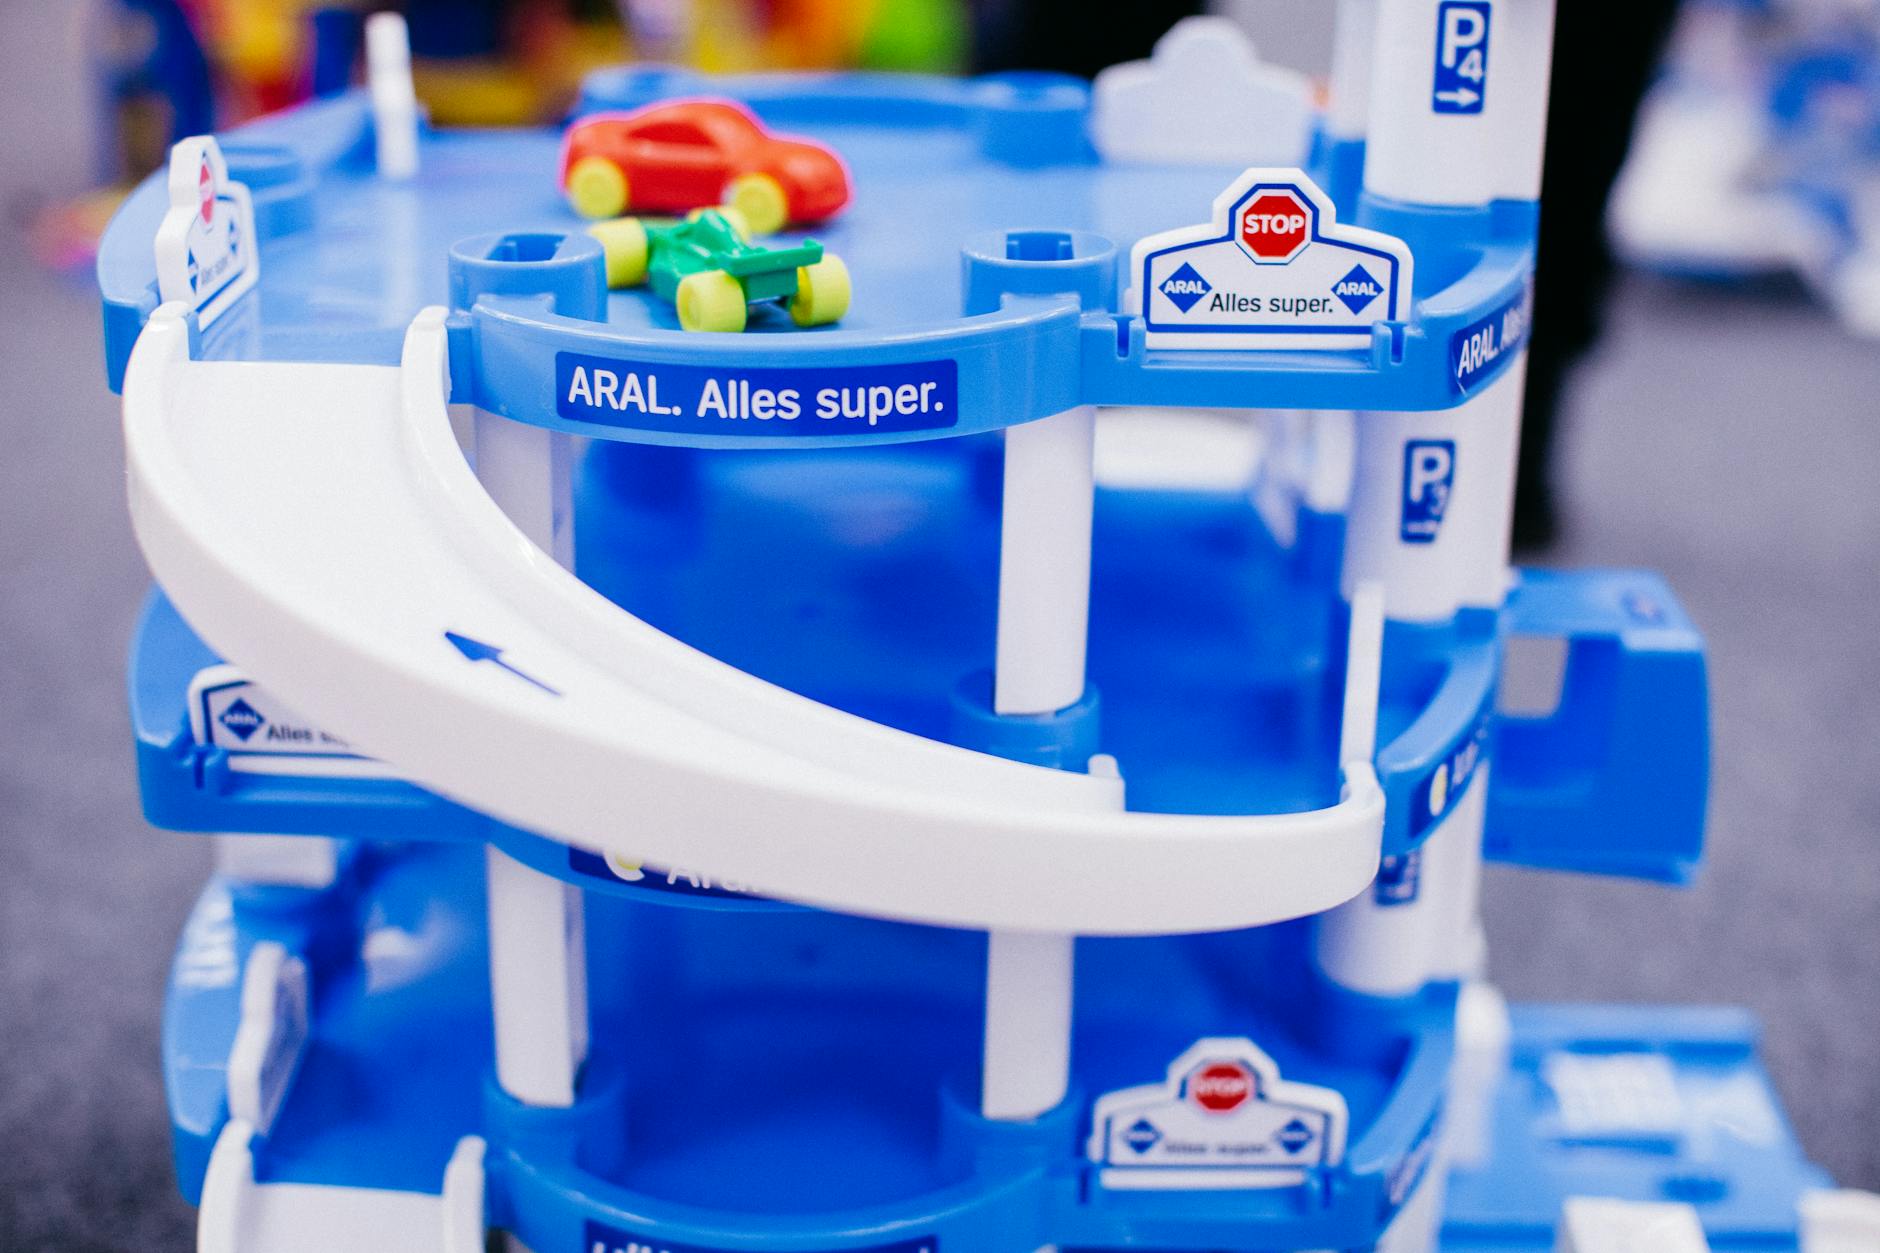
Force, Motion, and Engineering Design
The Engineering Design Process (EDP) frames these units: Ask, Imagine, Plan, Create, Improve. For science for 5th graders, this means concrete prototyping—building catapults that actually launch, then adjusting the fulcrum. Secondary students calculate trajectories on paper; your kids learn through iteration and failure. This distinction between physical testing and abstract calculation defines different strategies in teaching science across grade levels. This hands-on approach reflects integrative STEM education principles better than any worksheet.
Simple Machines Hunt: $0.50 per student, 10 minutes prep, low safety, aligns with NGSS PS2-A (forces and motion).
Balloon Cars & Catapults: $1.20 per student, 20 minutes prep, medium safety, covers NGSS PS2-B (types of interactions).
Circuit Builders: $3.00 per student, 30 minutes prep, high safety (electrical), hits NGSS PS3 (energy).
Simple Machines Scavenger Hunt and Construction
Start with the hunt. Send pairs through the school with tablets to photograph five simple machines per type: lever (door handles), pulley (window blinds), wheel/axle (door knobs), inclined plane (ramps), wedge (scissors), and screw (jar lids). They compile these into PicCollage presentations that explain mechanical advantage visually. This inquiry-based learning activity takes one class period and generates ownership through student photography.
Then build. Students construct a compound machine combining a lever and pulley system that lifts a 200g mass 20cm vertically. They use 5N spring scales to measure input and output force, calculating Mechanical Advantage (MA) = output/input. Successful designs require less than 10N input force, achieving MA >2. If their machine requires 15N, they return to the EDP and redesign, documenting what failed.
This is where pedagogical approaches to teaching science matter. Third graders might just identify the machines. Your fifth graders calculate MA and efficiency percentages. They troubleshoot why their pulley loses force to friction. It's concrete, measurable, and bridges the 5E instructional model from exploration to explanation.
Newton's Laws with Balloon Cars and Catapults
For Newton's Laws, balloon cars demonstrate action-reaction concretely. Students build 4-wheeled chassis from cardboard and straws, attaching a 9-inch balloon with a straw nozzle. They race the cars 3 meters across the floor, timing with stopwatches to calculate speed in m/s. Testing three inflation levels (10, 20, and 30 pumps) makes the relationship between force and acceleration visible. When the 30-pump car barely moves, they discover mass versus thrust limitations firsthand.
The catapult activity requires strict protocols. Build with three popsicle sticks for the arm, two for the base, and a rubber band fulcrum. Students launch 7g marshmallows at three different fulcrum positions, measuring distance in centimeters across five trials to calculate mean and range. Establish firing lines with cones and mandate safety glasses before anyone touches the materials. This is concrete prototyping, not abstract calculation.
Know when to skip this. Low ceilings or classes needing high behavioral structure should avoid catapults entirely. Demonstrate the 45-degree maximum launch angle and horizontal-only aiming rule before student handling. One unsafe motion means immediate activity termination for the entire group. These effective science teaching strategies prioritize safety over completion.
Circuit Electricity Building and Troubleshooting
Electricity units in STEM curriculum work best when students handle actual components. Use Snap Circuits Jr. kits ($20 each) or 9V batteries with alligator clips and 3V bulbs. Have them build both series (one path) and parallel (multiple paths) circuits, rating brightness on a 1-5 scale and timing how long batteries last in each configuration. This connects to NGSS standards PS3 directly and makes energy transfer visible.
Teach the systematic fix. When circuits fail, students check: (1) battery orientation (+/-), (2) loose alligator clips, (3) bulb functionality by bypassing, and (4) short circuits. Eighty percent of failures stem from reversed batteries or loose connections. The remaining twenty percent usually involve short circuits where students created a direct loop from positive to negative without passing through the bulb. Documenting these errors becomes part of the scientific method process.
Prevent the spark. Teach the "no direct loop" rule explicitly to avoid short circuits. Use battery holders with safety springs rather than letting students touch 9V terminals directly. These hands-on experiments require more prep than others, but the troubleshooting skills transfer to every future investigation your students will conduct.
What Are the Most Engaging Space Science Activities?
The most engaging science for 5th graders includes building scale solar system models across school grounds using toilet paper units (1 sheet = 10 million km), tracking moon phases with Oreo cookies over 28 days, and engineering Mars rover landers using egg-drop challenges with $5 budget constraints. These combine kinesthetic learning, observation, and design thinking while aligning with NGSS standards.
Stop lecturing about dwarf planets. Get them outside. Let them eat the science.
These three hands-on experiments rank highest for engagement based on hands-on time percentage and student choice data. Students spend 85% of class time manipulating materials. They accommodate 24-32 students with minimal technology—just toilet paper, cookies, and straws.
Unlike strategies in teaching science in secondary level that often rely on virtual simulations, these pedagogical approaches emphasize spatial reasoning and scale comprehension over exoplanet fact memorization. Real astronomy comprehension comes from walking true scale distances.
Space Activity Cost-Benefit Analysis:
Toilet Paper Solar System: $3 per class, 15 minutes prep, high conceptual depth for scale comprehension within any STEM curriculum.
Oreo Moon Phases: $8 per class, 10 minutes prep, medium depth for pattern recognition using the scientific method.
Mars Rover Challenge: $5 per group, 20 minutes prep, high depth for engineering design following the 5E instructional model.
For digital supplements, try these interactive STEM games and activities.
Scale Solar System Models Across School Grounds
Use one toilet paper sheet to represent 10 million kilometers. Mercury sits 6 sheets from the Sun (58 million km), Earth at 15 sheets (150 million km), and Neptune stretches to 450 sheets (4.5 billion km).
Assign object sizes: a peppercorn for Mercury, a marble for Earth, a basketball for Jupiter. Place a yellow flag at the school entrance to mark the Sun. Students walk the distances carrying planet cards while you time them reaching Neptune—about ten minutes of walking past the 28-sheet asteroid belt.
Calculate the scale factor (1:10 trillion). Compare this to science for 3rd graders who use compressed logarithmic models rather than true scale representations.
Moon Phase Tracking with Oreo Cookies
Buy two packages of Oreos—eight cookies per group of four students. Twist them open to model phases: New Moon has no cream, Waxing Crescent shows right 25%, First Quarter right 50%, Waxing Gibbous right 75%, Full Moon keeps all cream, then wane leftward.
Students arrange cookies in a circle on black paper. Over 28 days, they sketch nightly observations or use a Moon Phase Calendar app when clouds block the sky. They compare sketches to their edible models and identify waxing versus waning using the Northern Hemisphere "right side light" rule.
For allergen-free schools, substitute plasticine clay. Watch for the common error: students think "waxing" means growing larger rather than increasing illumination. Clarify immediately.
Mars Rover Landing Engineering Challenges
Give each group $5 to protect a raw egg dropped from 2 meters. Pricing: 10 straws ($0.10), 1 paper sheet ($0.50), 1 meter tape ($1), 2 balloons ($0.50), 1 cup ($0.50). The lander must hit a 30cm × 30cm target.
Impose strict constraints: total mass under 200 grams, mandatory parachute for air resistance, and crumple zones for shock absorption. Teams build three iterative prototypes and calculate class success rates as survival percentages. This follows the inquiry-based learning cycle.
Most failures come from rigid structures or tangled parachutes. Teach "loose packing" rather than tight wrapping for better shock absorption. This approach beats textbook diagrams of Martian geology.
How Do You Integrate Science with Literacy and Math?
Integrate science with literacy and math by using the Claim-Evidence-Reasoning framework for writing lab conclusions, having students graph experimental data using line plots and bar charts with proper scales and intervals, and analyzing science text has like diagrams and glossaries during research projects. This reinforces that scientists communicate through multiple modalities while meeting cross-curricular standards.
Stop teaching subjects in isolation. When your 5th graders measure plant growth daily and defend their conclusions with numbers, science becomes the bridge between math calculations and literacy skills.
Science for 5th graders works best when standards overlap. The Cross-Curricular Integration Matrix maps three units: Plant Growth focuses on measurement and data collection; Chemistry emphasizes graphing reaction times; Ecosystems targets informational writing and text features. This hits cross-curricular standards without sacrificing inquiry time.
Your teaching and learning strategies in science must push past observation. Require students to defend claims with quantitative data. When arguing ice melts faster on metal, "because it looked wetter" fails. "Because metal lost 15 grams in 10 minutes while wood lost 3 grams" succeeds. Numbers force precision.
Use this CER Rubric for 10-minute exit tickets:
4 - Advanced: Claim with 3+ quantitative data points and accurate reasoning.
3 - Proficient: All components present but evidence qualitative only.
2 - Developing: Missing reasoning or inaccurate connection.
1 - Beginning: Claim only stated.
Science Argumentation and Claim-Evidence-Reasoning Writing
The CER framework breaks scientific thinking into claim, evidence, and reasoning. After hands-on experiments conclude, students state a one-sentence claim, support it with three quantitative data points, and connect to scientific principles using starters like "I claim..." and "This makes sense because..."
In a plant unit, a student writes: "I claim cress grows faster in soil. Evidence: Day 7 soil 4.2cm vs sand 1.1cm; Day 14 soil 8.5cm vs sand 2.3cm. This makes sense because soil retains moisture." This shows using evidence to back up scientific arguments. Score these immediately.
Advanced scores require quantitative evidence; proficient means all parts present but qualitative. This immediate feedback follows the 5E instructional model and supports designing effective science instruction what works in science classrooms.
Data Analysis and Graphing Real-World Experiments
Graphing turns raw data into visual arguments. Use line graphs for continuous data like plant growth, with Y-axis 0-10cm and X-axis days 0-14. Use bar graphs for categorical comparisons. Require mean, median, and range calculations for three or more trials.
Teach TAILS: Title, Axis labels with units, consistent Interval, Labels for variables, Scale starting at zero. That zero-start prevents distortion. I have seen students manipulate scales to exaggerate tiny differences. Stop that habit early by checking their axes first.
Google Sheets auto-generates line-of-best-fit, while graph paper with 1cm squares works for most 5th grade work. Advanced groups add error bars showing measurement uncertainty of plus or minus 0.5cm, addressing NGSS standards for data variability.
Science Text Feature Analysis and Research Projects
Scientists communicate through text features, not just paragraphs. Have students hunt through National Geographic Kids books for captions, diagrams, bold vocabulary, indexes, and glossaries. They create a "Feature Function" booklet explaining how each element aids comprehension.
The two-week research project investigates local ecosystem threats using three sources: one book, one database like PebbleGo, and one credible website. Students use Cornell note-taking and produce a poster with labeled diagrams and cited sources. This meets STEM curriculum goals.
Differentiate with graphic organizers for struggling readers or simplified scientific abstracts for advanced students. Both groups practice the scientific method and inquiry-based learning at appropriate levels while mastering academic research skills.
Implementation Tips for Managing Hands-On Science
Safety comes first in any lab setting. Before your students touch a beaker for hands-on experiments, get those Flinn Scientific safety contracts signed by both students and parents. Post emergency eye wash and shower locations clearly — 5th graders forget under pressure, and you need them to know exactly where to go during any chemical splash or fire emergency. Review the locations monthly. Post them by the door and near the demo table.
48 hours before: Gather materials and check inventory. Missing batteries or dead pH strips kill momentum.
24 hours before: Set up stations and test every procedure yourself. If you can't do it in five minutes, they can't either.
Day-of (15 minutes): Arrange materials for 30 students. Place items at each table, not just in a central pile.
Cleanup (5 minutes): Assign roles — Materials Manager, Recorder, Timekeeper, Safety Officer. Everyone knows their specific job before the lab starts.
Know when to skip the lab. These methods and strategies in teaching science don't work in every context. Never run activities if students haven't completed safety training. Periods shorter than 30 minutes don't allow time for the scientific method plus proper cleanup. If your class requires constant 1:1 supervision for behavioral issues, group lab work becomes unsafe. Use digital simulations or teacher demonstrations instead. Protecting students matters more than checking an activity box.
Store unit supplies in labeled shoeboxes — one per table. This keeps your science for 5th graders organized and eliminates the material scramble at the start of class. Cover tables with plastic tablecloths for messy labs involving water or soil; cleanup drops to three minutes. Keep a spray bottle and paper towels at each station. Students handle spills immediately instead of waiting for you to cross the room.
Post a visual checklist: materials returned, desks wiped, floor clear. Nobody leaves until every box is checked. These effective classroom management strategies and tools that transform classroom management make inquiry-based learning possible in busy classrooms. They align with NGSS standards and the 5E instructional model, supporting both strategies for teaching basic science and technology and teaching strategies in science secondary level. Your STEM curriculum succeeds when logistics fade into the background and students focus on discovery.
Where Science For 5Th Graders Is Heading
The days of reading from a textbook and calling it science are over. Your students need to touch the dry ice, argue about ecosystem boundaries, and fail at their first egg drop design. NGSS standards aren't just a checklist—they're a shift toward kids actually doing science, not just memorizing vocabulary words.
What's changing is the move toward phenomenon-based learning and true inquiry-based learning. The 5E instructional model isn't going anywhere, but you'll see more integration between your STEM curriculum and your literacy block. Science isn't a Friday afternoon treat anymore; it's becoming the context for teaching reading and math.
Stay ahead by letting go of perfection. You don't need a fully stocked lab to start. Pick one unit—matter, ecosystems, or forces—and run it through the 5E cycle this semester. Watch where kids get stuck. That's your data. Next year, you'll know exactly which hands-on activity to tweak.
Still grading everything by hand?
EMStudio is a free teaching management app — manage your classes, students, lessons, and more!
Learn More
Still grading everything by hand?
EMStudio is a free teaching management app — manage your classes, students, lessons, and more!
Learn More


Notion4Teachers
Notion templates to simplify administrative tasks and enhance your teaching experience.


2026 Notion4Teachers. All Rights Reserved.
Notion4Teachers
Notion templates to simplify administrative tasks and enhance your teaching experience.
2026 Notion4Teachers. All Rights Reserved.
Notion4Teachers
Notion templates to simplify administrative tasks and enhance your teaching experience.
2026 Notion4Teachers. All Rights Reserved.