
How Teachers Can Help Students Find and Verify Reliable Online Data
How Teachers Can Help Students Find and Verify Reliable Online Data

Article by
Milo
ESL Content Coordinator & Educator
ESL Content Coordinator & Educator
All Posts
Students can find numbers, charts, maps, and claims in seconds. That speed is useful, but it does not mean they know what to trust. A class project can quickly fall apart when students build their work around outdated statistics, copied infographics, vague summaries, or information that never really answers their question.
Learning how to find reliable online data is now part of classroom research. A science investigation, a social studies comparison, a media literacy task, or a presentation all ask students to do more than gather quick facts. They need to slow down, check where information comes from, and decide whether it is strong enough to use. Teachers do not need to turn every lesson into a research methods class, but a few steady habits can make online research clearer, more careful, and more useful.
Still grading everything by hand?
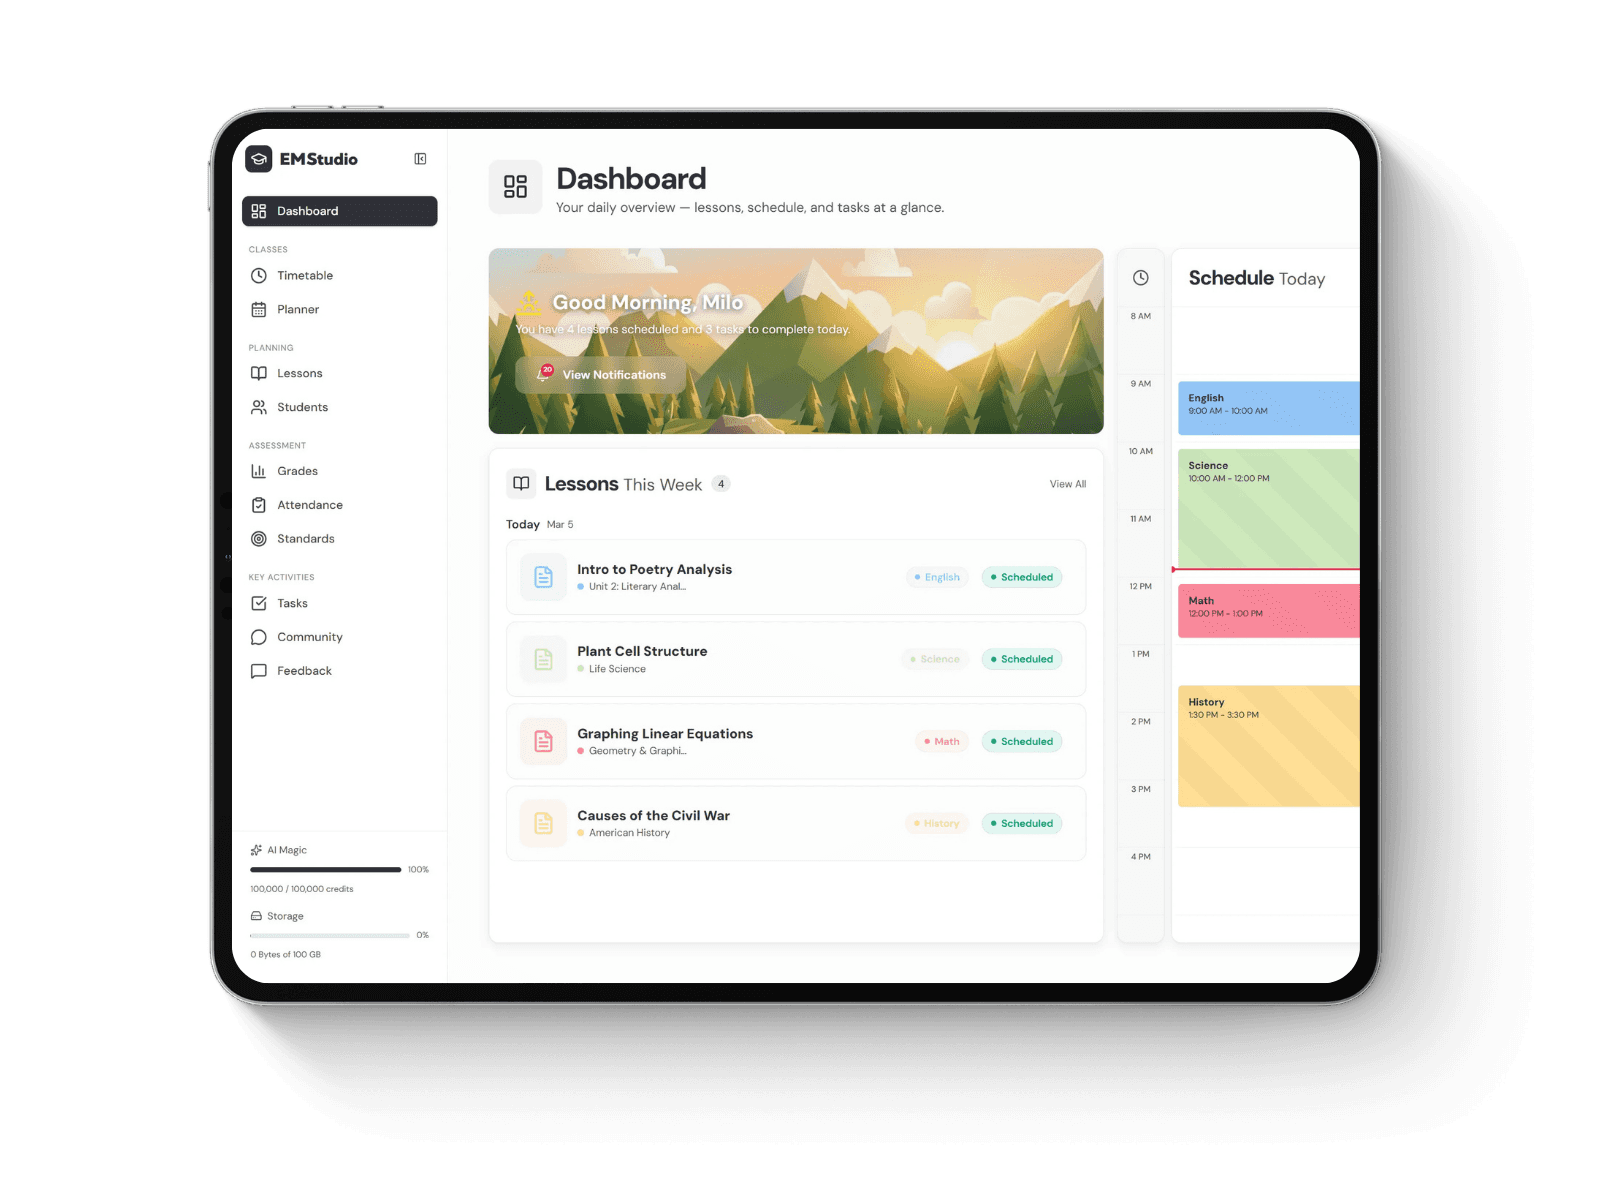
EMStudio is a free teaching management app — manage your classes, students, lessons, and more!
Learn More
Still grading everything by hand?
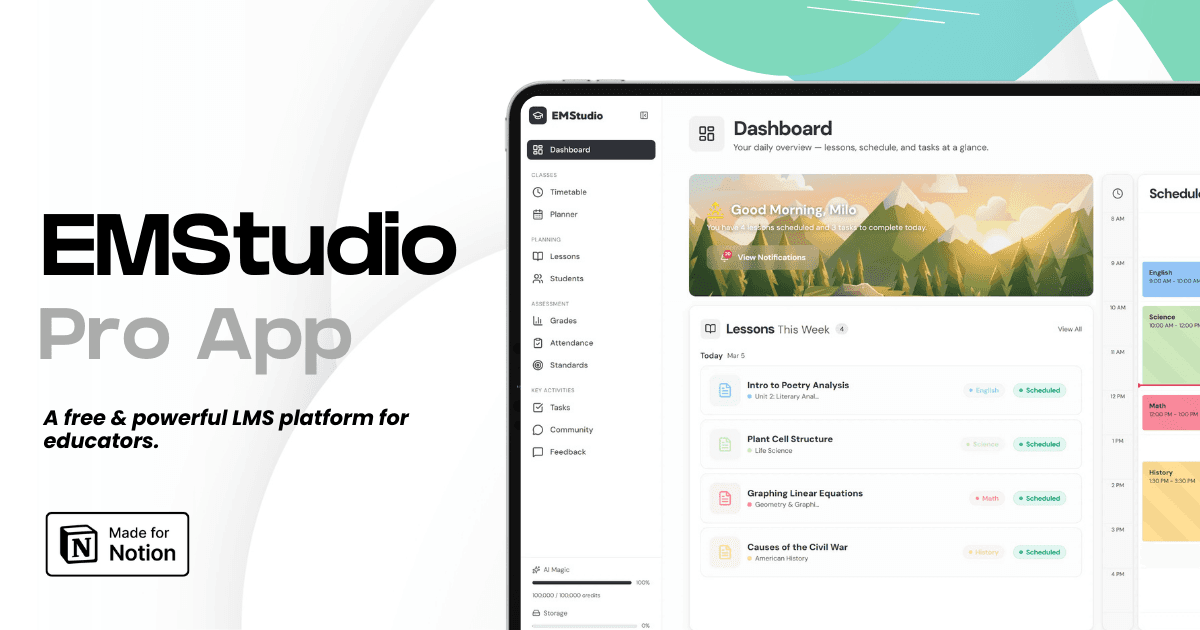
EMStudio is a free teaching management app — manage your classes, students, lessons, and more!
Learn More
Table of Contents
Why Reliable Online Data Matters in Student Research
Online data can make student work feel connected to the real world, but only when students understand what they are looking at. A number on a website is not automatically helpful. A graph can look convincing while leaving out key context. A statistic can be true in one setting and misleading in another.
When students rely on weak or unclear data, the final work usually shows it. Their arguments become harder to support. Their charts may not connect to the question. Their presentations can start to feel more decorative than evidence-based.
Reliable data gives students a stronger starting point. It helps them compare ideas, notice patterns, ask better follow-up questions, and explain their thinking with more confidence.
This applies across subjects. In science, students might compare classroom observations with broader trends. In social studies, they might look at population, voting, or economic data. In English, they might use survey results to support an argument. In math, they might build visual models from real-world figures rather than invented examples.
The goal is not to turn every student into an expert researcher. It is to help them see that strong conclusions begin with information they can trust.
Start With the Question Before Searching
Students often begin research by typing the broadest possible topic into a search bar. That usually leads to scattered results, shallow summaries, and sources that only partly connect to the assignment. A better starting point is the research question.
Before students search, ask them to write the question in one clear sentence. Then have them underline what the question is really asking for. Are they looking for a number, a trend, a comparison, a cause, a location, a time period, or an example? That small step gives the search a purpose.
For example, “climate change” is too broad for most classroom projects. “How have summer temperatures changed in our city over the past 20 years?” gives students a clearer path. They know they need location-specific data, a time range, and a way to compare values over time.
The same approach works in other subjects. A student researching reading habits, school attendance, local history, or public health should be able to identify the type of information that would actually answer the question.
Teachers can make this easier with one simple prompt: “What would count as evidence for this?” When students can answer that question before they search, they are more likely to choose useful information rather than grabbing the first result that looks official.
Teach Students to Look Beyond Search Results
Search results are useful for getting started, but they are rarely the strongest place for students to stop. The first few links often lead to summaries, opinion pieces, copied statistics, or pages that combine several claims without showing where the numbers came from. Students need to learn when a general webpage is enough and when the assignment calls for something more direct.
This matters most when students are studying patterns over time. A short article might describe a trend, but the underlying data helps students test whether that trend appears in a specific place, year, or situation. In science, geography, or environmental studies projects, students can use classroom observations alongside weather data for research to compare patterns across dates, seasons, and locations.
Teachers can frame this as a shift from “What does the internet say?” to “What information would let us check this ourselves?” That question pushes students toward tables, datasets, maps, reports, survey results, and original records. It also makes research feel less like collecting quotes and more like building a case from evidence.
A useful classroom habit is to have students label each source by type. Is it a summary, a primary source, a dataset, an opinion, a news report, or a visual explanation? Once students can name the kind of source they are using, they are more likely to understand what it can and cannot prove.
Help Students Check Where the Data Comes From
Once students find online data, the next step is asking where it came from. A dataset, chart, or statistic can look polished and still be incomplete, outdated, or poorly matched to the question. Students need a simple routine for slowing down before they copy a number into their notes.
A good classroom check can start with four questions: Who collected the data? When was it collected? How was it collected? What does it leave out? These questions help students see that data is created through choices. A survey depends on who answered. A map depends on what was measured. A chart depends on the time period, categories, and scale.
Students need repeated practice evaluating websites before they can decide whether a dataset, chart, or claim belongs in their work. That practice should include looking beyond a page's design and checking authorship, purpose, accuracy, and whether other credible sources support the information.
This habit works best when teachers model it with examples. Show students two charts on the same topic and ask which one they trust more. Ask what information is missing. Have them revise a weak source note by adding the date, source type, method, and reason it fits the research question. Over time, students begin to see source checking as part of research, rather than an extra step added at the end.
Build Digital Habits That Reduce Guesswork
Online research becomes easier when students repeat the same small habits each time they work with digital information. Instead of treating source checks as a separate task, teachers can build them into the normal research process.
One useful habit is keeping a simple source log. For each source, students can record the title, author or organization, date, type of information, and one reason it belongs in the project. This slows the process down in a good way. Students begin to see that collecting links is not the same as collecting evidence.
Teachers can help students strengthen their digital literacy skills by giving them repeated chances to compare sources side by side. Two pages might cover the same topic, but one may have clearer authorship, stronger data, better context, or a more current date. Those comparisons help students develop judgment instead of relying on the first result that looks polished.
A simple routine can make this manageable: save the source, label the source type, check the date, identify who created it, and explain why it fits the question. When students practice that process often, research becomes less about guessing and more about making careful choices.
Turn Reliable Data Into Classroom Work Students Can Explain
Finding reliable data matters most when students can do something thoughtful with it. Once they have checked a source, they need to connect the information back to the original question and explain what the data shows.
Teachers can help by asking students to write a short “data statement” before they create a chart, slide, or paragraph. The statement can answer three questions: What does the data show? What pattern stands out? What still needs more context? This keeps students from turning numbers into decoration and helps them treat data as part of their thinking.
Students should also learn that clear visuals do not replace clear explanations. A graph may show a change over time, but the student still needs to describe the trend, name the evidence, and avoid claiming more than the data supports. If a chart compares two groups, students should explain what was measured, where the information came from, and why the comparison matters.
This is where research becomes communication. Students move from collecting information to making meaning from it. When they can explain how they found the data, why they trusted it, and what it supports, their final work becomes stronger, more honest, and easier for others to understand.
Helping Students Become More Careful Researchers
Students do not become careful online researchers after one lesson. They build that judgment through repeated practice, clear expectations, and small routines that make source checking feel normal. The goal is not to make every search perfect. The goal is to help students pause long enough to ask better questions before they trust what they find.
That habit matters beyond one assignment. Students who can find and verify reliable online data are better prepared to read claims, question charts, compare sources, and explain their thinking in a world full of fast information. They learn that strong research is not about collecting the most links. It is about choosing information carefully and using it honestly.
When teachers make these habits part of everyday classroom work, students become more independent researchers. They know where to start, what to check, and how to explain why their evidence belongs. That confidence makes online research less random and gives students a stronger foundation for learning across subjects.
Interlinking suggestion:
From:https://www.notion4teachers.com/blog/technology-literacy-guide-k12-educators to this article with anchor: checking online data before using it
Why Reliable Online Data Matters in Student Research
Online data can make student work feel connected to the real world, but only when students understand what they are looking at. A number on a website is not automatically helpful. A graph can look convincing while leaving out key context. A statistic can be true in one setting and misleading in another.
When students rely on weak or unclear data, the final work usually shows it. Their arguments become harder to support. Their charts may not connect to the question. Their presentations can start to feel more decorative than evidence-based.
Reliable data gives students a stronger starting point. It helps them compare ideas, notice patterns, ask better follow-up questions, and explain their thinking with more confidence.
This applies across subjects. In science, students might compare classroom observations with broader trends. In social studies, they might look at population, voting, or economic data. In English, they might use survey results to support an argument. In math, they might build visual models from real-world figures rather than invented examples.
The goal is not to turn every student into an expert researcher. It is to help them see that strong conclusions begin with information they can trust.
Start With the Question Before Searching
Students often begin research by typing the broadest possible topic into a search bar. That usually leads to scattered results, shallow summaries, and sources that only partly connect to the assignment. A better starting point is the research question.
Before students search, ask them to write the question in one clear sentence. Then have them underline what the question is really asking for. Are they looking for a number, a trend, a comparison, a cause, a location, a time period, or an example? That small step gives the search a purpose.
For example, “climate change” is too broad for most classroom projects. “How have summer temperatures changed in our city over the past 20 years?” gives students a clearer path. They know they need location-specific data, a time range, and a way to compare values over time.
The same approach works in other subjects. A student researching reading habits, school attendance, local history, or public health should be able to identify the type of information that would actually answer the question.
Teachers can make this easier with one simple prompt: “What would count as evidence for this?” When students can answer that question before they search, they are more likely to choose useful information rather than grabbing the first result that looks official.
Teach Students to Look Beyond Search Results
Search results are useful for getting started, but they are rarely the strongest place for students to stop. The first few links often lead to summaries, opinion pieces, copied statistics, or pages that combine several claims without showing where the numbers came from. Students need to learn when a general webpage is enough and when the assignment calls for something more direct.
This matters most when students are studying patterns over time. A short article might describe a trend, but the underlying data helps students test whether that trend appears in a specific place, year, or situation. In science, geography, or environmental studies projects, students can use classroom observations alongside weather data for research to compare patterns across dates, seasons, and locations.
Teachers can frame this as a shift from “What does the internet say?” to “What information would let us check this ourselves?” That question pushes students toward tables, datasets, maps, reports, survey results, and original records. It also makes research feel less like collecting quotes and more like building a case from evidence.
A useful classroom habit is to have students label each source by type. Is it a summary, a primary source, a dataset, an opinion, a news report, or a visual explanation? Once students can name the kind of source they are using, they are more likely to understand what it can and cannot prove.
Help Students Check Where the Data Comes From
Once students find online data, the next step is asking where it came from. A dataset, chart, or statistic can look polished and still be incomplete, outdated, or poorly matched to the question. Students need a simple routine for slowing down before they copy a number into their notes.
A good classroom check can start with four questions: Who collected the data? When was it collected? How was it collected? What does it leave out? These questions help students see that data is created through choices. A survey depends on who answered. A map depends on what was measured. A chart depends on the time period, categories, and scale.
Students need repeated practice evaluating websites before they can decide whether a dataset, chart, or claim belongs in their work. That practice should include looking beyond a page's design and checking authorship, purpose, accuracy, and whether other credible sources support the information.
This habit works best when teachers model it with examples. Show students two charts on the same topic and ask which one they trust more. Ask what information is missing. Have them revise a weak source note by adding the date, source type, method, and reason it fits the research question. Over time, students begin to see source checking as part of research, rather than an extra step added at the end.
Build Digital Habits That Reduce Guesswork
Online research becomes easier when students repeat the same small habits each time they work with digital information. Instead of treating source checks as a separate task, teachers can build them into the normal research process.
One useful habit is keeping a simple source log. For each source, students can record the title, author or organization, date, type of information, and one reason it belongs in the project. This slows the process down in a good way. Students begin to see that collecting links is not the same as collecting evidence.
Teachers can help students strengthen their digital literacy skills by giving them repeated chances to compare sources side by side. Two pages might cover the same topic, but one may have clearer authorship, stronger data, better context, or a more current date. Those comparisons help students develop judgment instead of relying on the first result that looks polished.
A simple routine can make this manageable: save the source, label the source type, check the date, identify who created it, and explain why it fits the question. When students practice that process often, research becomes less about guessing and more about making careful choices.
Turn Reliable Data Into Classroom Work Students Can Explain
Finding reliable data matters most when students can do something thoughtful with it. Once they have checked a source, they need to connect the information back to the original question and explain what the data shows.
Teachers can help by asking students to write a short “data statement” before they create a chart, slide, or paragraph. The statement can answer three questions: What does the data show? What pattern stands out? What still needs more context? This keeps students from turning numbers into decoration and helps them treat data as part of their thinking.
Students should also learn that clear visuals do not replace clear explanations. A graph may show a change over time, but the student still needs to describe the trend, name the evidence, and avoid claiming more than the data supports. If a chart compares two groups, students should explain what was measured, where the information came from, and why the comparison matters.
This is where research becomes communication. Students move from collecting information to making meaning from it. When they can explain how they found the data, why they trusted it, and what it supports, their final work becomes stronger, more honest, and easier for others to understand.
Helping Students Become More Careful Researchers
Students do not become careful online researchers after one lesson. They build that judgment through repeated practice, clear expectations, and small routines that make source checking feel normal. The goal is not to make every search perfect. The goal is to help students pause long enough to ask better questions before they trust what they find.
That habit matters beyond one assignment. Students who can find and verify reliable online data are better prepared to read claims, question charts, compare sources, and explain their thinking in a world full of fast information. They learn that strong research is not about collecting the most links. It is about choosing information carefully and using it honestly.
When teachers make these habits part of everyday classroom work, students become more independent researchers. They know where to start, what to check, and how to explain why their evidence belongs. That confidence makes online research less random and gives students a stronger foundation for learning across subjects.
Interlinking suggestion:
From:https://www.notion4teachers.com/blog/technology-literacy-guide-k12-educators to this article with anchor: checking online data before using it
Still grading everything by hand?
EMStudio is a free teaching management app — manage your classes, students, lessons, and more!
Learn More
Still grading everything by hand?
EMStudio is a free teaching management app — manage your classes, students, lessons, and more!
Learn More


Notion4Teachers
Notion templates to simplify administrative tasks and enhance your teaching experience.



2026 Notion4Teachers. All Rights Reserved.
Notion4Teachers
Notion templates to simplify administrative tasks and enhance your teaching experience.
2026 Notion4Teachers. All Rights Reserved.
Notion4Teachers
Notion templates to simplify administrative tasks and enhance your teaching experience.
2026 Notion4Teachers. All Rights Reserved.