
Helping IB Biology students separate evidence from explanation
Helping IB Biology students separate evidence from explanation

Article by
Milo
ESL Content Coordinator & Educator
ESL Content Coordinator & Educator
All Posts

Illustrative study scene. AI-generated image.
"The rate rises because the molecules have more kinetic energy." A student might write this beside an enzyme graph and give a reasonable biological explanation. If the question asks for a description of the results, however, the answer has left the observed pattern unstated. The teacher needs to establish whether the student can read the data as well as recall the mechanism.
Teachers can practise this distinction through one small dataset, asking students to separate what they observe from what they infer.
The classroom activity below uses temperature and enzyme activity. It includes a dataset, suggested questions and sample responses for discussion. All data and student responses are invented for this activity. They are not experimental findings, official IB questions or an official mark scheme.
Still grading everything by hand?
EMStudio is a free teaching management app — manage your classes, students, lessons, and more!
Learn More

Still grading everything by hand?
EMStudio is a free teaching management app — manage your classes, students, lessons, and more!
Learn More
Table of Contents
Start with a dataset students can inspect
In the hypothetical investigation, students measure the initial rate of product formation by the same enzyme at six temperatures. They keep pH, enzyme concentration and initial substrate concentration constant. Each value is the mean of three hypothetical trials; the individual results and measurement uncertainties are not supplied.
Temperature in °C | Mean initial rate in µmol of product per minute |
10 | 3 |
20 | 7 |
30 | 15 |
40 | 22 |
50 | 10 |
60 | 2 |
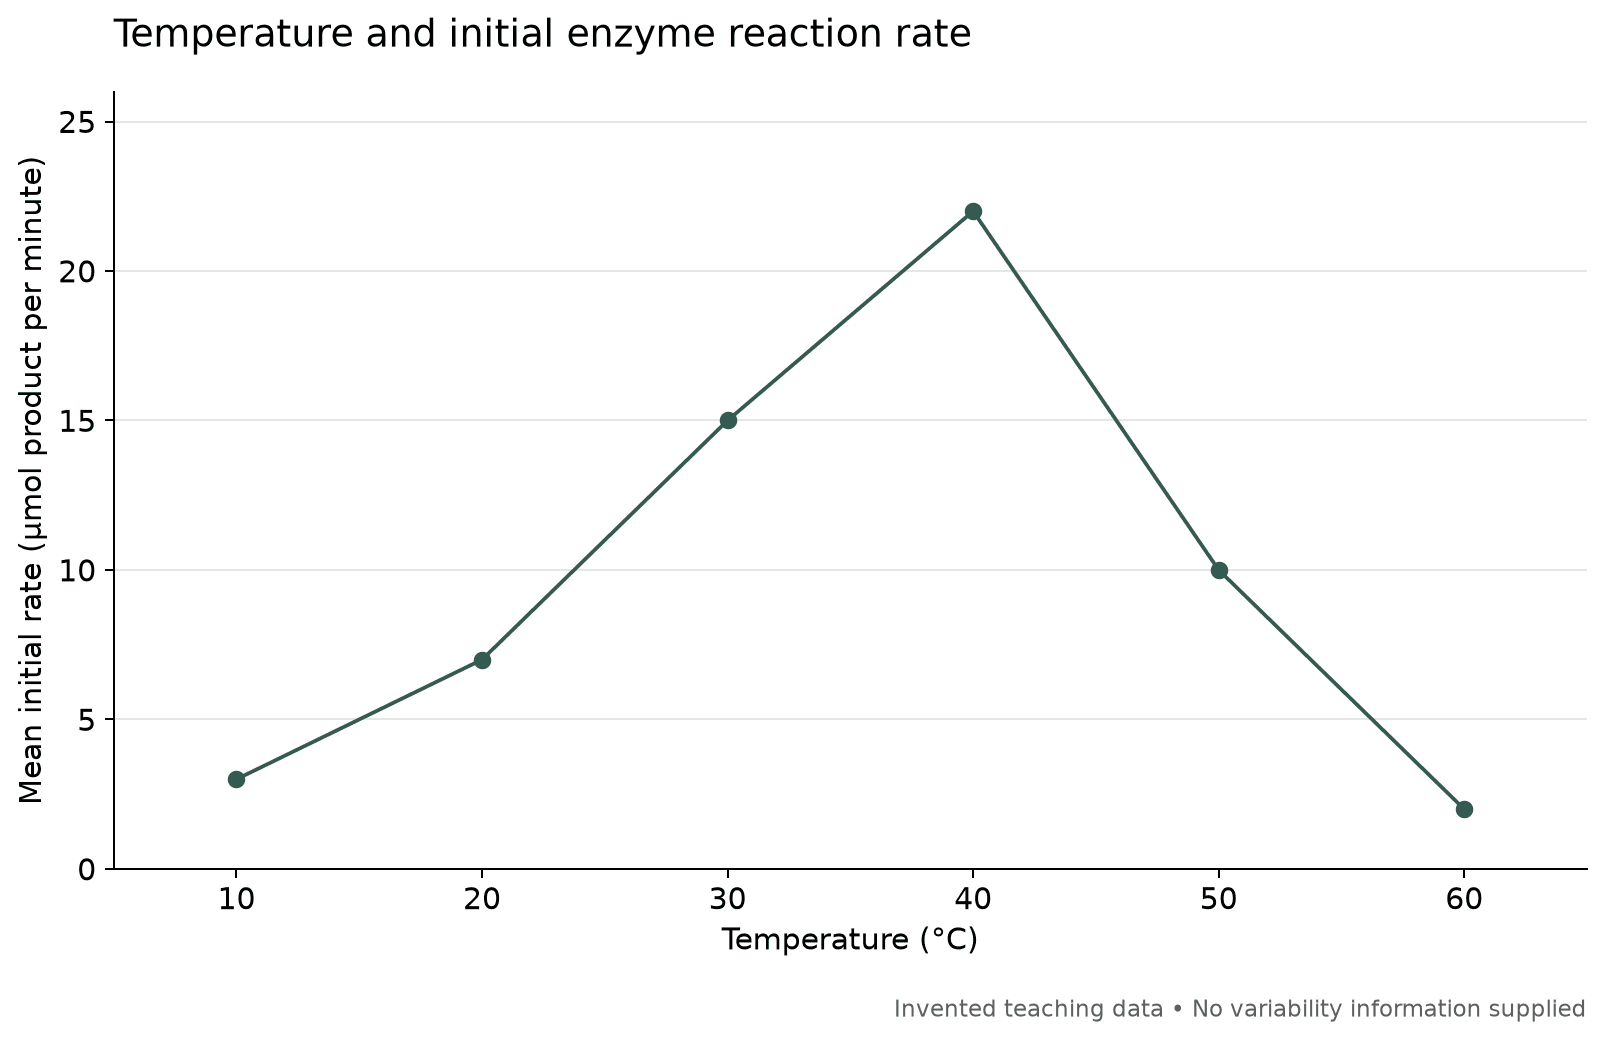
Figure 1. Invented teaching data. Straight lines connect the sampled means to help readers follow the pattern; they do not establish rates between those temperatures. No error bars are shown because variability has not been supplied.
Before discussing enzymes, ask students to identify the measured quantity, the units and the temperature range. This brief check can expose a problem that subject explanations would otherwise hide. A student who calls the vertical axis "amount of product" has overlooked that the results describe a rate.
Ask for a description before a mechanism
Use this prompt: "Describe how the mean initial reaction rate changes across the temperatures tested. Support your description with values."
A suggested response is: "The mean initial rate increases from 3 µmol per minute at 10°C to 22 µmol per minute at 40°C. It then decreases to 2 µmol per minute at 60°C. The highest measured mean rate is at 40°C."
The response identifies the change in direction and anchors it to the data. It does not need an explanation of molecular movement to answer this particular prompt. Ask students to point to the part of the graph supporting each statement. That makes it easier to distinguish a reading error from a difficulty putting the pattern into words.
Avoid teaching that every description must contain a fixed number of values. The appropriate detail depends on the question. Here, the instruction specifically asks for values, and quoting them helps make the rise and fall unambiguous.
Examine what the explanation adds
Now ask: "Explain why an increase in temperature could increase the initial rate between 10°C and 40°C, and suggest a reason for the decrease at higher temperatures."
A suggested explanation is: "As temperature increases, enzyme and substrate molecules have greater average kinetic energy. More frequent successful encounters can increase the rate of product formation. At higher temperatures, disruption of the enzyme's structure may alter its active site and reduce catalytic activity."
Discuss the final sentence carefully. The falling rate is consistent with a loss of enzyme activity through denaturation, but these rate measurements alone do not directly demonstrate structural change. The mechanism is a biological explanation applied to the pattern. Establishing the cause would require more evidence about the enzyme and the procedure.
This is a useful place to revisit a common phrase: "The enzyme dies." Ask students to replace it with an account of structure and function. Enzymes are molecules, and a change in catalytic activity needs a molecular explanation.
Test a conclusion that goes beyond the measurements
Give students this claim: "The experiment proves that the enzyme's optimum temperature is exactly 40°C." Ask them to evaluate it using the information provided.
A defensible response would be: "40°C has the highest mean rate among the temperatures tested. The exact optimum has not been established because temperatures between the sampled points were not tested. Individual trial results and uncertainty information are also needed to assess how dependable the differences are."
Follow with a practical question: "What additional measurements would help?" Students could propose testing smaller temperature intervals around the observed peak and reporting the spread of repeated measurements. Ask them to explain what each change would resolve. Closer temperature intervals improve the resolution of the peak; repeat measurements help assess variability.
Keep the conclusion tied to the investigation. Different enzymes and assay conditions can produce different temperature responses. This invented dataset provides no basis for treating 40°C as a universal optimum.
Make the feedback match the missing step
Consider this invented student response to the description prompt: "The enzyme works best at 40°C because heat gives it energy, and at 60°C it dies."
There are several things to discuss, but they do not all need the same correction. "Works best" leaves the measured quantity and evidence vague. The explanation arrives before the student has described the pattern. "Dies" introduces a separate problem with biological terminology.
A teacher might begin with: "Describe the rise and fall using the rate values and units. Put your explanation in a separate sentence." After that correction, the teacher can address the mechanism and the limits of the optimum claim. This sequence makes the feedback manageable without treating every weakness as a need to relearn the whole topic.
For a short paired activity, ask one student to underline statements supported directly by the table and another to circle proposed explanations. Then have them identify any conclusion that needs more evidence. Their choices provide a starting point for discussion, rather than a substitute for checking the science.
Transfer the distinction to another question
For the next task, change the context. A photosynthesis dataset, for example, can ask students to describe a pattern before considering possible limiting factors. Keep the material within the class's course scope and check that the supplied information supports the intended explanation.
When selecting further practice, the EduNinja IB Biology HL question bank provides a topic directory to browse. Inspect the individual question, its data and the available answer guidance before assigning it; topic listings do not establish that every question fits this activity. SL students need material appropriate to their course.
The next response should show whether the student can carry the distinction into unfamiliar material. Can they state what was measured, describe the pattern accurately and explain it without claiming more than the evidence supports? Those features give the teacher something specific to review beyond whether the final answer sounds biologically plausible.
Author bio
Henry Yang is the founder of EduNinja, an independent study platform. EduNinja is not affiliated with or endorsed by the International Baccalaureate Organization.
Start with a dataset students can inspect
In the hypothetical investigation, students measure the initial rate of product formation by the same enzyme at six temperatures. They keep pH, enzyme concentration and initial substrate concentration constant. Each value is the mean of three hypothetical trials; the individual results and measurement uncertainties are not supplied.
Temperature in °C | Mean initial rate in µmol of product per minute |
10 | 3 |
20 | 7 |
30 | 15 |
40 | 22 |
50 | 10 |
60 | 2 |
Figure 1. Invented teaching data. Straight lines connect the sampled means to help readers follow the pattern; they do not establish rates between those temperatures. No error bars are shown because variability has not been supplied.
Before discussing enzymes, ask students to identify the measured quantity, the units and the temperature range. This brief check can expose a problem that subject explanations would otherwise hide. A student who calls the vertical axis "amount of product" has overlooked that the results describe a rate.
Ask for a description before a mechanism
Use this prompt: "Describe how the mean initial reaction rate changes across the temperatures tested. Support your description with values."
A suggested response is: "The mean initial rate increases from 3 µmol per minute at 10°C to 22 µmol per minute at 40°C. It then decreases to 2 µmol per minute at 60°C. The highest measured mean rate is at 40°C."
The response identifies the change in direction and anchors it to the data. It does not need an explanation of molecular movement to answer this particular prompt. Ask students to point to the part of the graph supporting each statement. That makes it easier to distinguish a reading error from a difficulty putting the pattern into words.
Avoid teaching that every description must contain a fixed number of values. The appropriate detail depends on the question. Here, the instruction specifically asks for values, and quoting them helps make the rise and fall unambiguous.
Examine what the explanation adds
Now ask: "Explain why an increase in temperature could increase the initial rate between 10°C and 40°C, and suggest a reason for the decrease at higher temperatures."
A suggested explanation is: "As temperature increases, enzyme and substrate molecules have greater average kinetic energy. More frequent successful encounters can increase the rate of product formation. At higher temperatures, disruption of the enzyme's structure may alter its active site and reduce catalytic activity."
Discuss the final sentence carefully. The falling rate is consistent with a loss of enzyme activity through denaturation, but these rate measurements alone do not directly demonstrate structural change. The mechanism is a biological explanation applied to the pattern. Establishing the cause would require more evidence about the enzyme and the procedure.
This is a useful place to revisit a common phrase: "The enzyme dies." Ask students to replace it with an account of structure and function. Enzymes are molecules, and a change in catalytic activity needs a molecular explanation.
Test a conclusion that goes beyond the measurements
Give students this claim: "The experiment proves that the enzyme's optimum temperature is exactly 40°C." Ask them to evaluate it using the information provided.
A defensible response would be: "40°C has the highest mean rate among the temperatures tested. The exact optimum has not been established because temperatures between the sampled points were not tested. Individual trial results and uncertainty information are also needed to assess how dependable the differences are."
Follow with a practical question: "What additional measurements would help?" Students could propose testing smaller temperature intervals around the observed peak and reporting the spread of repeated measurements. Ask them to explain what each change would resolve. Closer temperature intervals improve the resolution of the peak; repeat measurements help assess variability.
Keep the conclusion tied to the investigation. Different enzymes and assay conditions can produce different temperature responses. This invented dataset provides no basis for treating 40°C as a universal optimum.
Make the feedback match the missing step
Consider this invented student response to the description prompt: "The enzyme works best at 40°C because heat gives it energy, and at 60°C it dies."
There are several things to discuss, but they do not all need the same correction. "Works best" leaves the measured quantity and evidence vague. The explanation arrives before the student has described the pattern. "Dies" introduces a separate problem with biological terminology.
A teacher might begin with: "Describe the rise and fall using the rate values and units. Put your explanation in a separate sentence." After that correction, the teacher can address the mechanism and the limits of the optimum claim. This sequence makes the feedback manageable without treating every weakness as a need to relearn the whole topic.
For a short paired activity, ask one student to underline statements supported directly by the table and another to circle proposed explanations. Then have them identify any conclusion that needs more evidence. Their choices provide a starting point for discussion, rather than a substitute for checking the science.
Transfer the distinction to another question
For the next task, change the context. A photosynthesis dataset, for example, can ask students to describe a pattern before considering possible limiting factors. Keep the material within the class's course scope and check that the supplied information supports the intended explanation.
When selecting further practice, the EduNinja IB Biology HL question bank provides a topic directory to browse. Inspect the individual question, its data and the available answer guidance before assigning it; topic listings do not establish that every question fits this activity. SL students need material appropriate to their course.
The next response should show whether the student can carry the distinction into unfamiliar material. Can they state what was measured, describe the pattern accurately and explain it without claiming more than the evidence supports? Those features give the teacher something specific to review beyond whether the final answer sounds biologically plausible.
Author bio
Henry Yang is the founder of EduNinja, an independent study platform. EduNinja is not affiliated with or endorsed by the International Baccalaureate Organization.
Still grading everything by hand?
EMStudio is a free teaching management app — manage your classes, students, lessons, and more!
Learn More
Still grading everything by hand?
EMStudio is a free teaching management app — manage your classes, students, lessons, and more!
Learn More




Notion4Teachers
Notion templates to simplify administrative tasks and enhance your teaching experience.



2026 Notion4Teachers. All Rights Reserved.
Notion4Teachers
Notion templates to simplify administrative tasks and enhance your teaching experience.
2026 Notion4Teachers. All Rights Reserved.
Notion4Teachers
Notion templates to simplify administrative tasks and enhance your teaching experience.
2026 Notion4Teachers. All Rights Reserved.