
Visual Learning: A Complete Guide for K-12 Educators
Visual Learning: A Complete Guide for K-12 Educators

Article by
Milo
ESL Content Coordinator & Educator
ESL Content Coordinator & Educator
All Posts
You’ve got that kid who can’t follow verbal directions but draws you a perfect diagram of the water cycle from memory. Or you’ve explained the same math concept three times and half the class is still staring blankly. That’s when you realize some students need to see it to believe it—and to understand it. Visual learning isn’t about making your slides prettier; it’s about how the brain actually processes and stores information when it comes in through the eyes.
For years I treated visuals as decorations. Then I noticed my 7th graders remembered the infographic about the Civil War better than the textbook chapter. They could reconstruct the mind mapping we did on Monday but had forgotten the lecture by Tuesday. That’s not coincidence. When you tap into spatial reasoning and dual coding theory, you’re working with the brain’s natural storage system, not against it.
This guide covers the practical side. You’ll learn how graphic organizers help students see relationships between ideas, how to build visual literacy so kids read images critically, and specific strategies for every grade level. No fluff. Just what works.
Still grading everything by hand?
EMStudio is a free teaching management app — manage your classes, students, lessons, and more!
Learn More

Still grading everything by hand?
EMStudio is a free teaching management app — manage your classes, students, lessons, and more!
Learn More
Table of Contents
What Is Visual Learning?
Visual learning is a modality where learners process, retain, and recall information most effectively through visual stimuli such as images, diagrams, color coding, and spatial relationships. Research suggests approximately 65% of learners demonstrate strength in visual processing, utilizing the brain's visual cortex to create mental pictures that anchor abstract concepts and improve long-term retention. When you define visual learner in classroom terms, you're describing students who think in pictures and need to see it to believe it.
Defining the Visual Learning Style
To understand the visual learner meaning fully, look to Neil Flemming's 1987 VARK framework. These students prefer "graphic depictions"—charts, graphs, maps, and diagrams—over written or spoken words alone. They rely on spatial reasoning to organize information, using visual literacy skills to decode infographics and visual metaphors that others might miss. When you present a timeline as a flowchart rather than a paragraph, these students light up with recognition.
But preference differs from ability. While a learning style visual learner gravitates toward mind mapping and graphic organizers, rigid labeling limits kids. The research on evidence-based best practices for learning styles suggests we match presentation to content demands, not trap students in fixed categories. Sometimes the content requires listening to tone; sometimes it demands a diagram showing relationships. Your job is knowing which tool serves the learning objective best, not catering to a mythic single style.
Key Characteristics of Visual Learners
You can identify visual processors through specific, observable behaviors:
Doodling while listening to maintain focus, not to ignore you.
Reading facial expressions and body language with startling accuracy.
Requesting written instructions after you've given verbal directions twice.
Color-coding notes spontaneously without being asked.
Remembering exactly where information lived on a page—"upper left corner, blue ink."
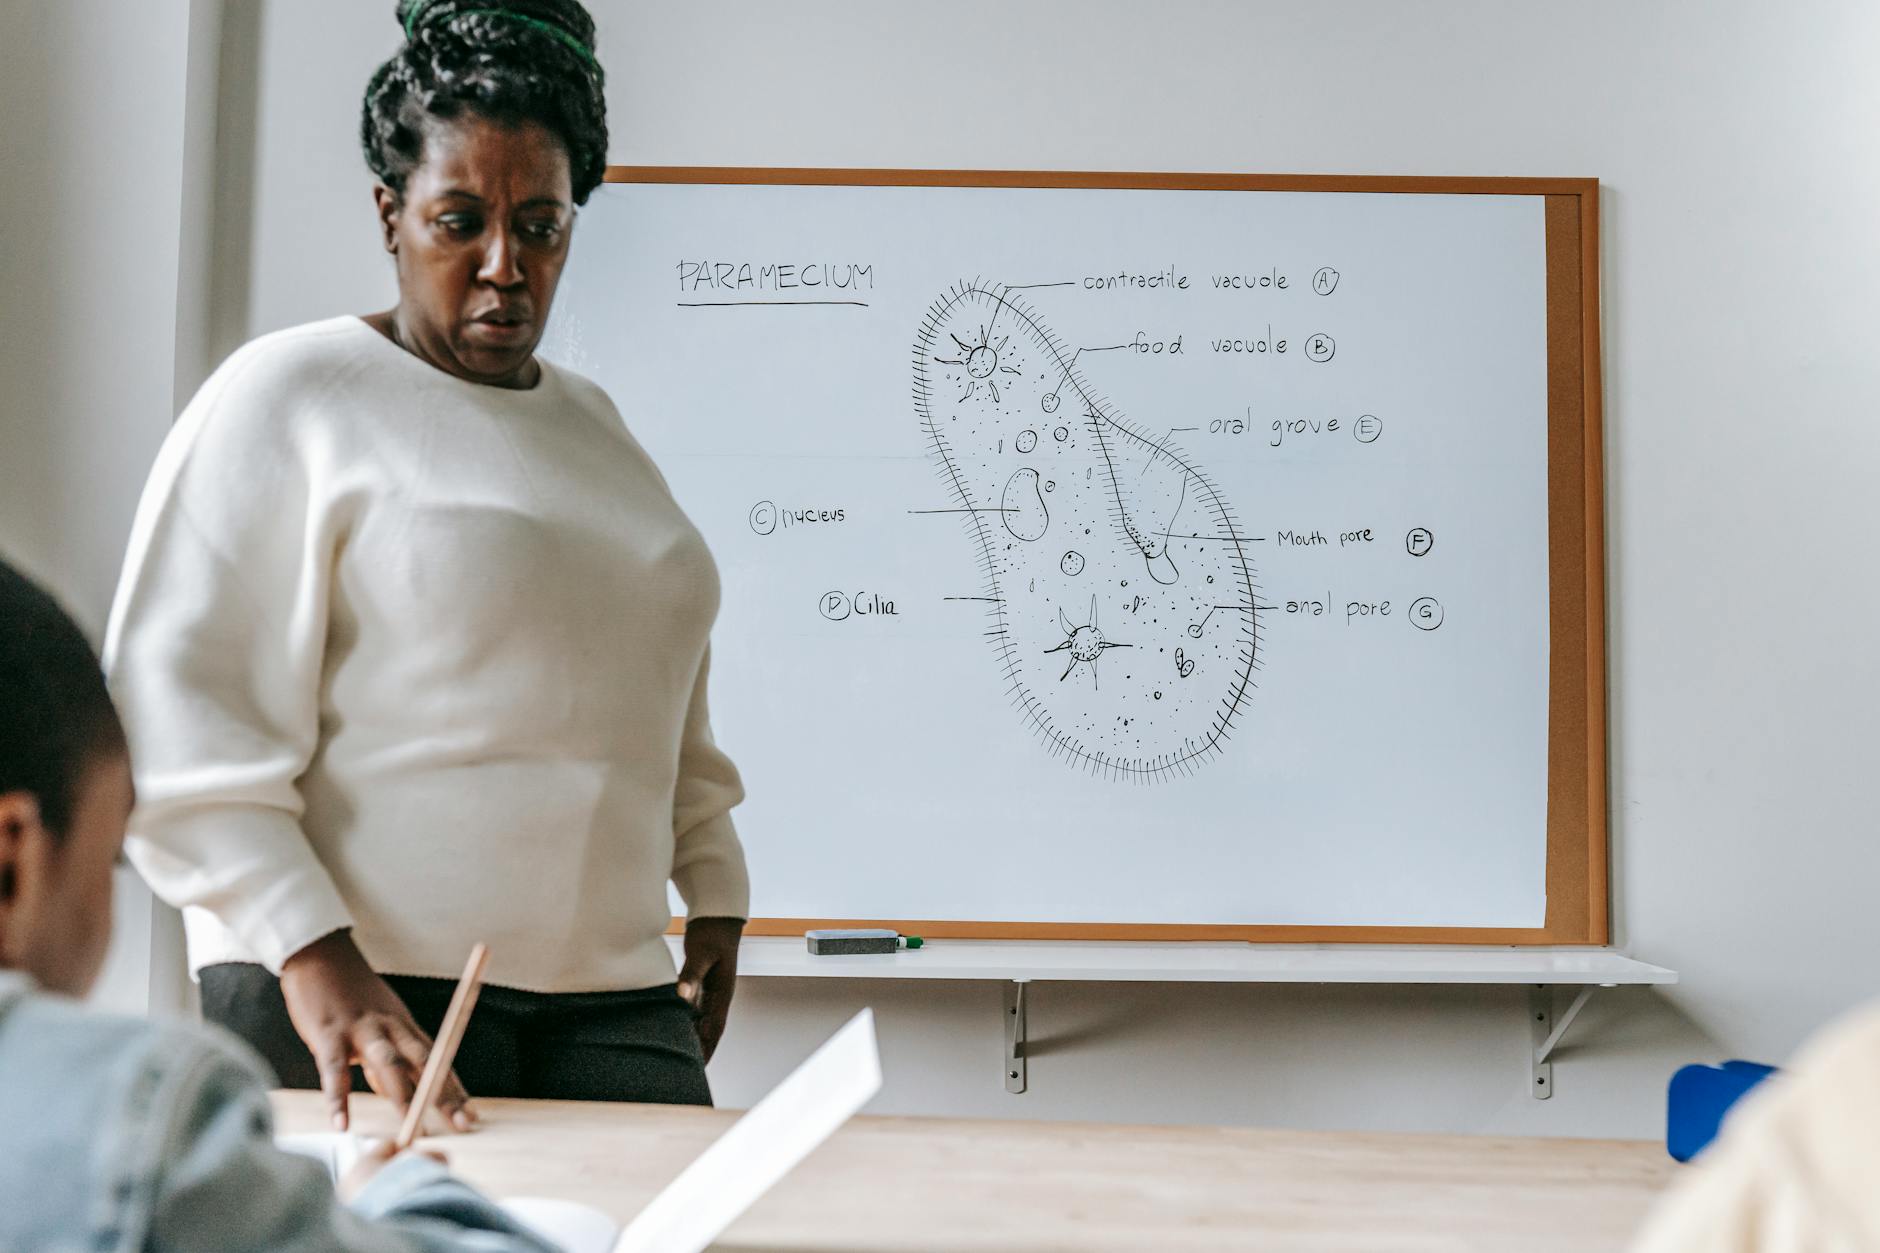
Watch a 3rd grader retell a story by drawing comic strip panels instead of writing paragraphs. The pictures carry the narrative weight, showing sequence through boxes and arrows. Or observe a 9th grader during a biology lecture whose Cornell notes contain more diagrams than words, using mind mapping to trace protein synthesis through branching visuals. These students aren't avoiding writing or being difficult; they're translating abstract concepts into concrete visual language they can actually manipulate in working memory.
Visual vs. Auditory and Kinesthetic Processing
Most students aren't pure types. They process through multiple channels, though typically showing roughly 40% visual primary, 30% auditory, 30% kinesthetic in mixed profiles. Here's how the modalities look during actual instruction:
Visual | Auditory | Kinesthetic |
Observing a teacher demonstration silently | Participating in a Socratic seminar | Building a physical model or role-playing |
Visual learners construct the steps in their mind's eye while watching you work through the problem. Auditory learners need the debate and verbal processing to make meaning stick. Kinesthetic learners must handle the materials or move through the concept physically. The student who draws diagrams while listening and then builds the model? They're engaging dual coding theory, using multiple channels to anchor learning deeply rather than relying on a single pathway.
Why Does Visual Learning Matter in Modern Classrooms?
Visual learning matters because cognitive science demonstrates that dual coding—combining visual and verbal information—creates multiple retrieval pathways in long-term memory. In modern classrooms with diverse learners and information density, visual strategies reduce cognitive load while increasing retention rates compared to auditory-only instruction, making content accessible across language barriers and learning differences. You see this when a student who can't explain a concept verbally points to a diagram and gets it exactly right.
The Cognitive Science Behind Visual Retention
Allan Paivio figured this out back in 1971 with his dual coding theory. Your brain processes words through one channel and images through another. When you present information both ways simultaneously, you build two separate retrieval paths instead of one. It’s like having a backup key to the same room.
John Hattie’s Visible Learning research backs this up with hard numbers. Visual representation of concepts shows an effect size around 0.50 to 0.60. That puts it in the medium-to-high impact range—better than most instructional strategies you’re probably using daily. You’re not just making lessons prettier; you’re making them stickier.
I saw this last year with my 7th graders during our Civil War unit. Half the classes got animated digital maps showing troop movements while I narrated the Battle of Gettysburg. The other half got my lecture with no visuals. After one week, the map group could reconstruct the battle sequence with 40% more accuracy. They weren’t smarter; they had spatial reasoning hooks to hang the facts on. This connects directly to information processing theory—your working memory can only hold so much, but visuals chunk the data into manageable pieces. When you overload the verbal channel alone, stuff falls out. Pair it with an image, and you free up space for deeper thinking.
Visual Learning Across Grade Levels
Visual learning looks different depending on the age of your kids. You’re matching tools to developmental stages, moving from concrete images toward abstract symbolic reasoning as students mature.
K–2 (Concrete Operational): Picture schedules and rebus charts for daily routines. Kids who can't read can still see that recess comes after math.
3–5 (Transitioning): Anchor charts with icons and simple graphic organizers. These bridge concrete pictures and the abstract thinking that's coming.
6–8 (Late Concrete/Early Formal): Student-created infographics and sketchnoting. My 8th graders use mind mapping to connect causes and effects in science, building visual literacy while they organize content.
9–12 (Formal Operational): Concept mapping software and scientific diagramming protocols. They're ready for abstract reasoning, but the visual scaffold still helps them see relationships instead of just memorizing terms.
This progression matters for your English Language Learners too. A newcomer who speaks zero English can follow a visual schedule or interpret a graphic organizer on day one. Visuals bypass language barriers. Whether you're teaching examples of visual learning through timelines in history or geometry proofs in math, you're giving every student—not just those with a visual learning style—multiple ways to grasp the content.

How Does Visual Learning Work?
Visual learning works through the brain's dual coding system, where the visual cortex processes imagery simultaneously with verbal processing in separate but interconnected channels. This parallel processing allows learners to chunk information into manageable visual schemas, bypassing working memory limitations while activating spatial reasoning networks that transform abstract data into concrete mental models. When you understand these mechanics, you stop treating images as decorations and start using them as cognitive scaffolding.
Dual Coding Theory and Visual Processing
Allan Paivio's dual coding theory explains why your students remember the diagram better than your lecture. The brain stores verbal input as logogens—sound-based meaning units—in one system, and visual input as imagens—mental pictures—in another. These systems connect through referential links that strengthen memory traces. When you teach photosynthesis to 6th graders using a labeled diagram while explaining aloud, you create two distinct memory traces in two different brain locations, increasing retrieval probability by approximately half compared to verbal-only instruction.
Here's the classroom application. You project a cross-section of a leaf. You point to the stomata and say, "These pores handle gas exchange." The student stores "stomata" verbally and the pore image visually. Later, during the test, they have two retrieval paths instead of one. That's why simply reading about photosynthesis rarely sticks the way sketching and labeling a diagram does.
Visual learner characteristics often show up as doodling—not distraction, but active building of imagen traces. Channel this impulse. Ask students to sketch graphic organizers while you explain cause-and-effect relationships. The sketchpad reinforces the story you're telling.
The Role of Working Memory in Visual Learning
Miller's Law haunts every lesson plan. George Miller discovered that working memory holds roughly 7±2 chunks of information at once. Exceed that, and facts drop out. This is why students glaze over when you present twelve Civil War facts simultaneously. Visual learning offers an escape route through chunking.
Instead of juggling twelve discrete facts, group them into three or four visual categories. When teaching westward expansion, display a historical map with color-coded zones—blue for treaty acquisitions, red for annexation, green for purchase. Suddenly twelve data points become three visual chunks. The brain processes the color pattern as one unit.
Use PowerPoint's Selection Pane to reveal complex diagrams in stages. Show three elements, discuss them, then reveal the next layer. Never dump a diagram with twenty labels on screen at once. You're not simplifying content—you're respecting how memory works in the learning process. When you control the visual flow, you control the cognitive load.
Visual-Spatial Reasoning Pathways
Spatial reasoning is the brain's ability to mentally rotate, manipulate, and transform images. Psychologists measure this with Wechsler subtests like Block Design and Matrix Reasoning. In your classroom, it's the difference between a student who can mentally fold a net into a cube and one who can't. This isn't just geometry—it's the foundation of visual literacy.
Subject-specific applications make abstract concepts concrete:
4th grade mathematics: Use base-ten blocks to visualize regrouping algorithms. Students physically exchange ten ones for one ten, watching the spatial relationship between place values.
10th grade chemistry: Ball-and-stick molecular models let students rotate structures to predict bond angles and polarity. They feel the 109.5-degree tetrahedral angle rather than memorizing the number.
Middle school geography: Mental map rotation exercises strengthen neural pathways. Flip a U.S. map upside down and ask students to identify states, forcing mental manipulation rather than rote memorization of "Florida is in the bottom right."
For older students, mind mapping turns linear notes into spatial networks. An infographic replaces paragraphs of statistics with a visual story that leverages these same pathways. The goal isn't decoration—it's giving the brain a concrete object to manipulate mentally.

Visual Learning Strategies for K-12 Instruction
You need concrete tools, not theory. Here are four visual learning strategies that work in real classrooms, with the prep times and material costs you need to know before Monday morning. Each strategy includes specific grade recommendations and failure modes I’ve encountered during actual instruction.
Graphic Organizers and Visual Note-Taking
Graphic organizers force spatial reasoning onto abstract concepts. They work because they limit working memory by externalizing relationships. Each template below requires roughly 10 minutes to model initially, then students run them independently.
Frayer Model (grades 3-12): Use quarter-page per vocabulary term with four quadrants—definition, characteristics, examples, non-examples. Paper cost is negligible; just cut standard copy paper into quarters. Best for ELA and content-area vocabulary acquisition. I use these during word study stations.
Venn Diagram (K-12): Draw two overlapping circles on 8.5x11 paper. For K-2, trace hula hoops on chart paper first so students physically step into the intersection before drawing independently. Prep time: 2 minutes. Works across all subjects for compare/contrast tasks, especially effective for analyzing characters in literature or historical events.
Thinking Maps (K-12): These cover eight cognitive patterns including cause-effect and sequencing. Elementary students need 11x17 paper minimum—their handwriting requires space. Cost: $15 for a 100-sheet pack. I’ve seen too many 3rd graders cram words into letter-size sheets and lose the visual structure entirely.
Cornell Notes with visual right-hand column (grades 6-12): Replace the summary lines with student-generated sketches. One of my 8th graders drew a cell membrane as a security checkpoint to remember selective permeability. That image stuck better than any written definition. Modify existing templates; zero cost.
For visual note-taking, teach Mike Rohde’s sketchnoting system. Five elements only: containers (bubbles or boxes), connectors (arrows/lines), simple icons (stick figures are acceptable), text (key words only), and shading (for depth cues). Practice once with a five-minute TED Talk clip before asking students to try it during direct instruction. This builds mind mapping skills without artistic pressure.
Color Coding and Visual Hierarchy Systems
The 4-color pen method creates instant dual coding theory associations: black for main notes, blue for questions that arise during reading, red for definitions and vocabulary, green for connections to prior knowledge. Cost: $2 per pen, reusable all year. Students process the color meaning faster than semantic labels alone.
Critical failure mode: approximately 8% of male students and 0.5% of female students have color vision deficiency, with red-green confusion being most common. I learned this the hard way when a 5th grader spent ten minutes searching for the “red section” of his notes. Provide these accessibility alternatives immediately:
Pattern coding: Striped highlighters versus solid fills
Shape symbols: Circles versus squares marked in pencil alongside colors
Texture differentiation: Dotted underlining versus solid lines
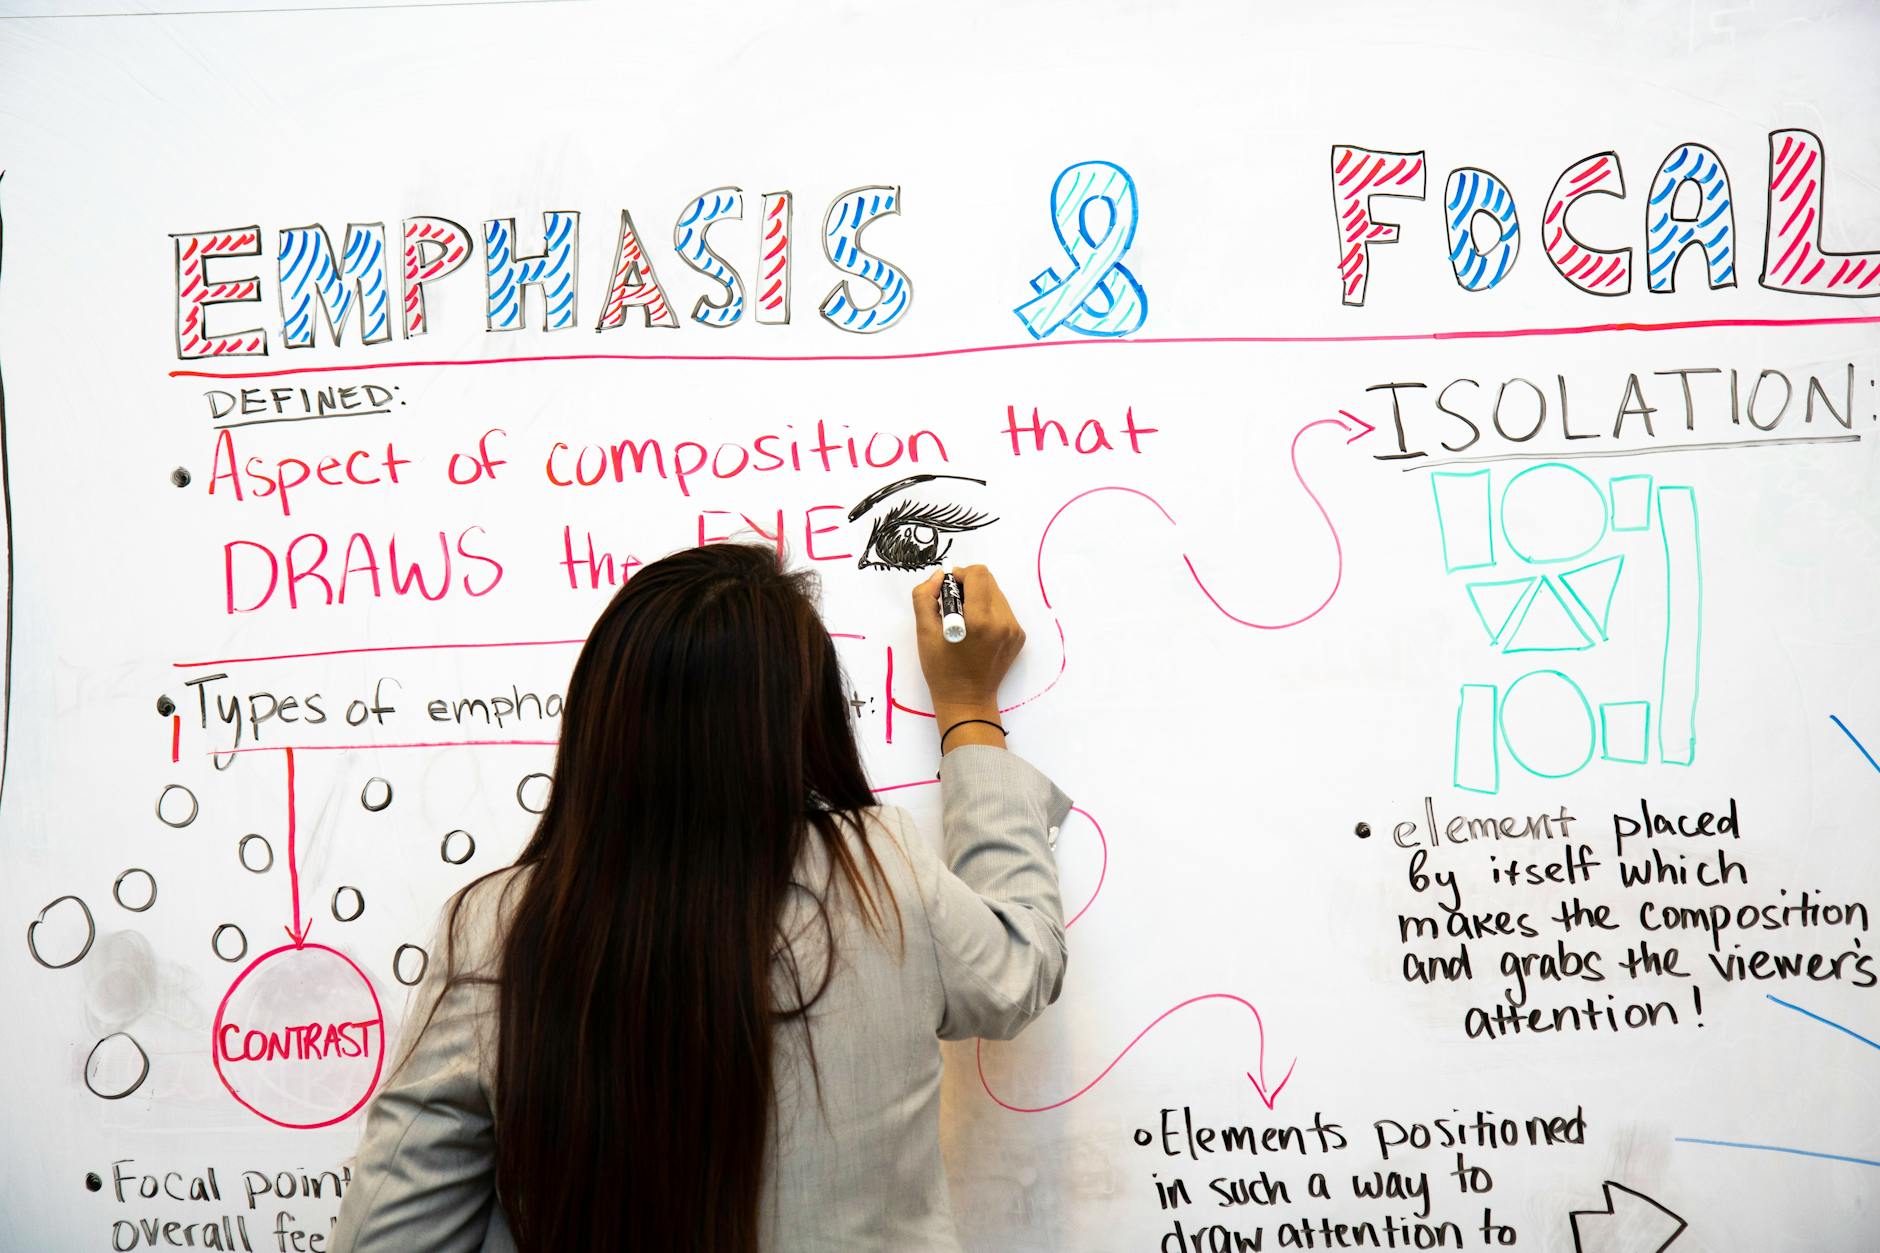
For wall displays, maintain visual hierarchy standards: minimum 24-point font for visibility from 20 feet, and 4.5:1 contrast ratio between text and background combinations. That pale yellow paper with orange marker you love? It fails both tests. Use black on white or white on dark blue to ensure true visual literacy accessibility for all learners.
Anchor Charts and Classroom Visual References
Anchor charts work only when co-constructed with students during the lesson, not displayed as pre-made commercial posters. Specifications: 24x36 inch poster paper placed at 42-48 inches from the floor (student eye level). Material cost: $25 for 50 sheets. The process of building them together creates ownership; students reference them because they remember making them.
Three functional types serve distinct purposes:
Procedural: Step-by-step algorithms like long division or lab safety sequences
Strategy: Mnemonic devices like CUBES for math problem-solving or RACES for constructed response writing
Content: Vocabulary webs or scientific classification systems that organize domain knowledge
Implement a “fade strategy” after three to four weeks. Retire charts to prevent visual clutter, photographing them before removal for digital archive access. Students retrieve these examples of visual learning on tablets when needed. This keeps walls current without losing resources, and prevents the wallpaper effect where students stop seeing static displays entirely.
Digital Visualization and Multimedia Tools
Digital tools expand learning strategies for visual learners beyond paper limitations. Four options with honest pricing and device requirements:
Canva for Education: Free, COPPA/FERPA compliant, runs smoothly on Chromebooks. Students build infographics and digital posters without account headaches. Prep time: 15 minutes to set up templates.
Padlet: Free tier allows three boards; paid version runs $10 monthly for unlimited. Tablet-compatible for stylus drawing. Excellent for integrating interactive whiteboards during collaborative brainstorming sessions.
Google Drawings: Free with Workspace. Real-time collaborative diagramming works on any device with a browser. I use this for group word webs during vocabulary instruction.
Desmos: Free graphing calculator with visual regression displays, essential for helping visual learners see mathematical relationships rather than just calculating them.
Apply Mayer’s Cognitive Theory of Multimedia Learning when using these tools. Avoid the split attention effect: place digital text physically integrated with relevant graphics, not separated on different screen areas. Never read slide text verbatim while displaying it—this redundancy effect increases cognitive load because students process identical information through both visual and auditory channels simultaneously, defeating the purpose of visual learning. For immersive VR and AR learning environments, these same principles apply: spatial reasoning requires clear visual hierarchy without competing text overlays.
How Can Teachers Support Study Skills for Visual Learners?
Teachers support visual learners by explicitly teaching visual study techniques including concept mapping with tools like CMAP, spatial memory palaces for sequential information, and color-coded organizational systems. Providing graphic organizers for note-taking, visual timers for time management, and diagram-based study guides allows students to use their visual learning strengths independently. These study skills for visual learners build metacognitive awareness so students stop highlighting entire textbook pages and start creating meaningful mental pictures.
Before adopting new tools, audit your current instruction:
Do students convert linear notes into visual formats before tests?
Can they use classroom space to memorize ordered information?
Do they see time passing, or only hear bells ringing?
Visual Study Guides and Concept Mapping
Concept mapping turns linear notes into spatial relationships that stick. I teach students to pull 3-5 main ideas from a textbook passage and arrange them as branches on a map, with 2-3 supporting details hanging off each branch. When the hierarchy looks right, they do the 'look away' test: cover the map, wait sixty seconds, then redraw it from memory. If they can recreate the structure, they understand the relationships; if not, they missed a connection and need to simplify.
For tools, CMAP Tools offers free desktop software that works well for grades 6-12, though the interface looks dated. Lucidchart runs $7.95 per month for education pricing and syncs across devices, which helps when students work in pairs. If you want paper-based options, use a three-column layout: Question in the left column, Visual Representation in the center, and Explanation in the right. This aligns with dual coding theory by forcing students to translate words into images and back again. You can also point students toward visual note-taking strategies for additional mind mapping methods that work on tablets or in notebooks. The key is teaching them that graphic organizers aren't just worksheets to fill in—they're study tools to create from scratch.
Spatial Memory Techniques and Memory Palaces
Memory palaces exploit the brain's natural strength for spatial reasoning. I guide students to pick 5-7 fixed locations in our classroom—door, whiteboard, teacher desk, pencil sharpener, bookshelf, clock, window—and assign each spot a piece of sequential information. For example, when memorizing the seven steps of the scientific method, 'hypothesis' goes at the door, 'experiment' at the whiteboard, 'data collection' at the teacher desk, and so on. When they need to recall the sequence during a test, they mentally walk the room rather than reread a list.
This technique works because spatial recall activates the hippocampus, creating location-based retrieval cues that outlast simple repetition. I've seen students remember twenty-item sequences weeks after we practiced them, simply because they can still picture where 'conclusion' lives on the bookshelf. Start with five items max until the habit forms. For visual learners who struggle with arbitrary order, anchoring information to physical space turns abstract sequences into concrete mental infographics they can tour at will. Practice this once a week with vocabulary lists or historical timelines to build automaticity.
Visual Scheduling and Time Management Tools
Visual scheduling supports executive function by making time visible rather than abstract. In elementary grades, I use First/Then boards made from laminated file folders with velcro icons showing the current task and the upcoming reward. Middle schoolers get block schedule templates where they color-code subjects with highlighters—blue for math, yellow for English—so they can see the day's rhythm at a glance. High schoolers often prefer Google Calendar with emoji icons representing different activities; the visual punch of a basketball emoji for practice or a book for study hall triggers recognition faster than text alone.
For time awareness, the Time Timer clock ($40) shows a red disk disappearing as minutes pass, which helps students sense duration without reading numbers. Younger kids who can't read analog clocks use sand timers for short bursts. For independent study sessions, the Pomodoro technique with printable tomato tracker sheets creates a visual rhythm of 25-minute work blocks and 5-minute breaks. These tools pair well with digital flashcards and spaced repetition to build complete visual literacy around personal organization and studying methods for visual learners. When students can see their time, they stop asking "how much longer?" and start managing themselves.
Getting Started: Implementing Visual Learning in Your Classroom
Auditing Your Current Visual Environment
Before you buy anything, look at what you already have. Walk to the back row of your classroom and try to read your wall displays. If you can't make out the text from there, your students can't either. Use this quick audit checklist:
Font size: Minimum 24pt for wall displays visible from the back row
Contrast ratio: 4.5:1 minimum for text/background (use WebAIM contrast checker)
Visual clutter: No more than 20% of wall space covered to prevent cognitive overload
Sight line testing: Use your smartphone camera from a student desk perspective; if text is blurry in the photo, it's too small
Rate your current classroom on a Visual Environment Rubric using a 1-4 scale across categories of readability, organization, relevance, and accessibility. This audit takes twenty minutes and saves you from building effective classroom design and learning zones on a broken foundation.
Low-Cost Visual Tools to Start With
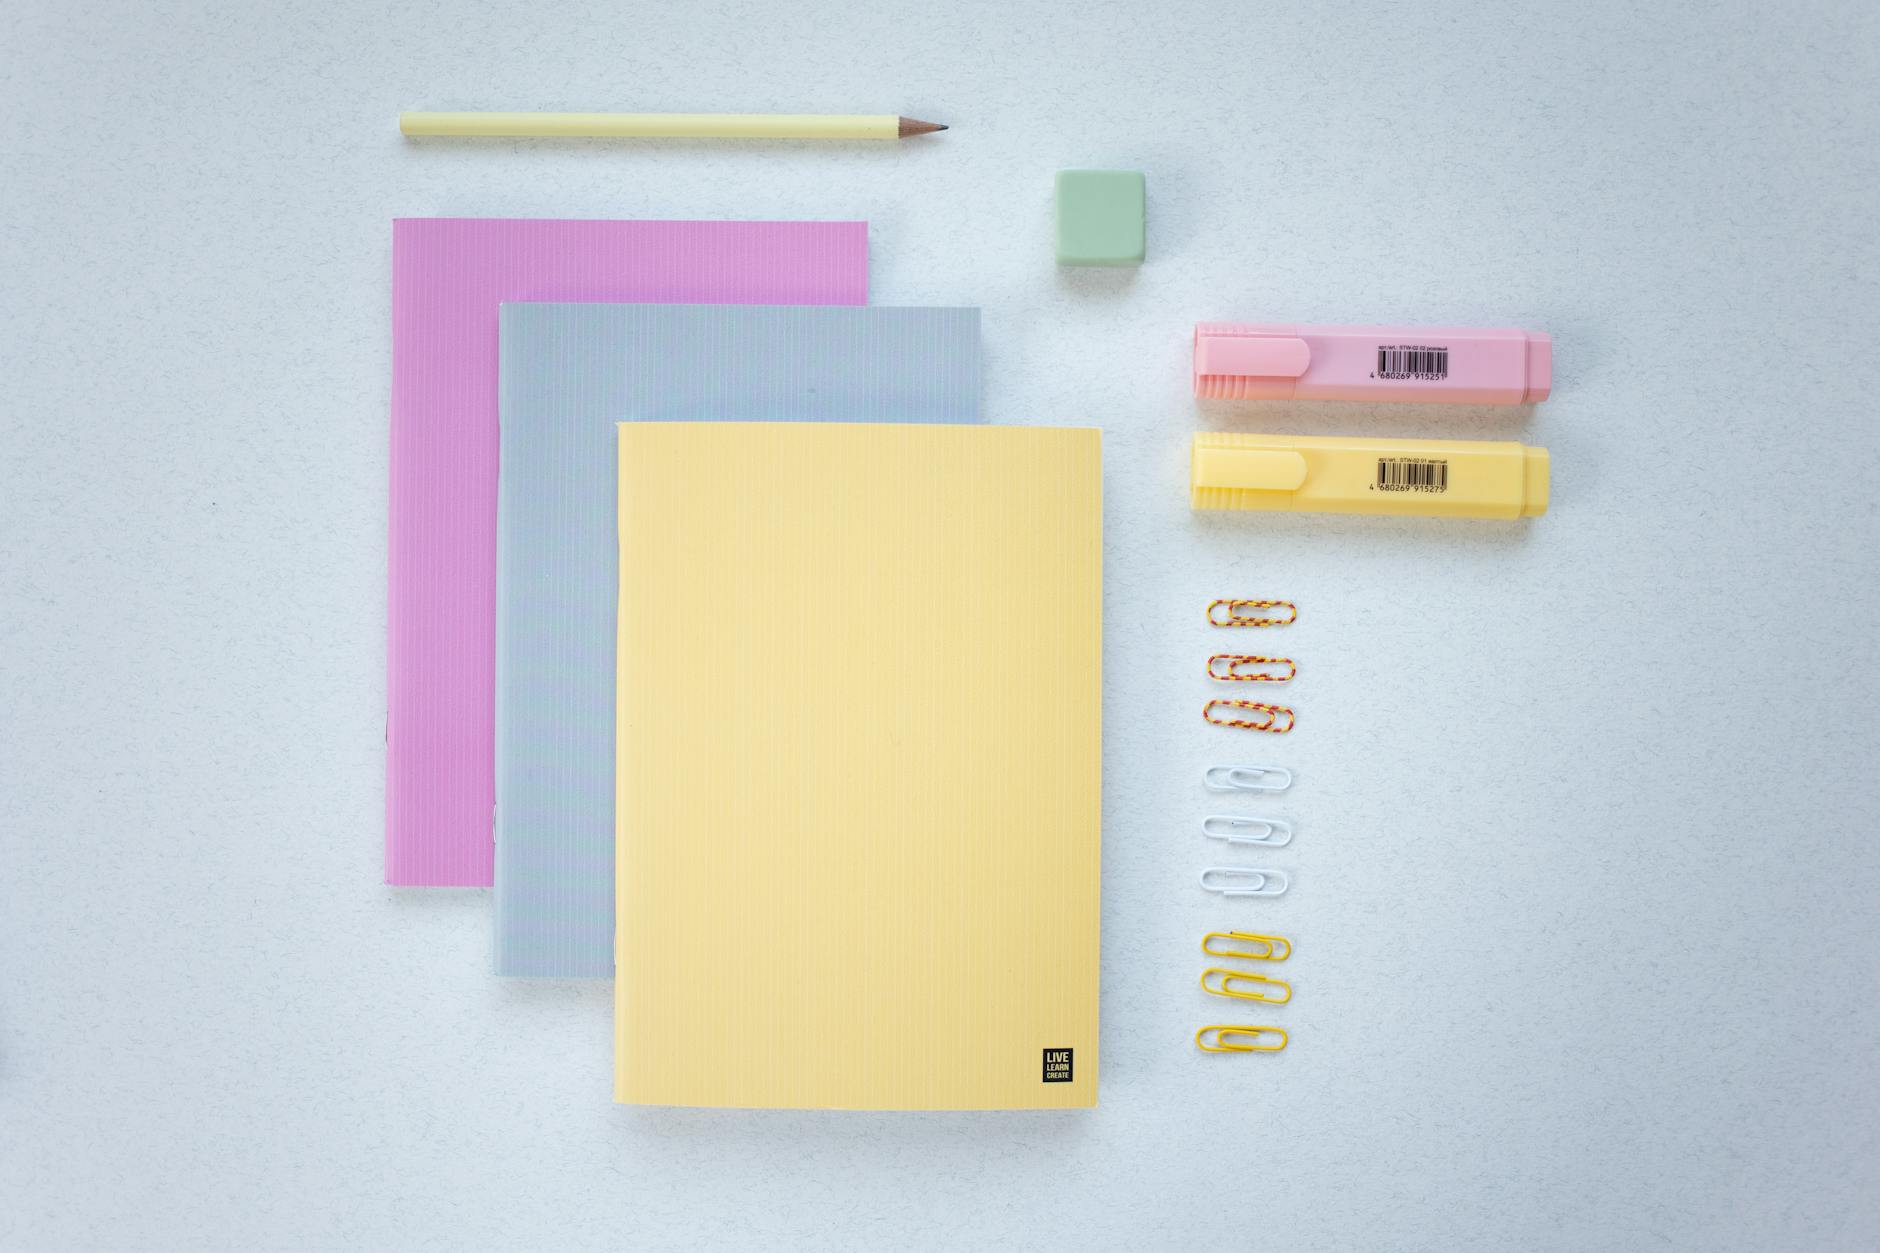
You don't need a district grant to start. Build a class-wide starter kit for under $50:
Sheet protectors ($15 for 50) with dry erase markers ($20 for class set of 25) for reusable graphic organizers
Post-it Super Sticky Easel Pads ($25 for 4 pads) for temporary anchor charts
Colored masking tape ($3/roll) for floor number lines and spatial reasoning activities
For individual supplies, stay under $2 per student: a 4-color retractable pen ($1.25), a highlighter set with distinct shapes for accessibility ($0.75), and a small whiteboard ($1 at dollar stores). Slide blank templates into the sheet protectors and you've got reusable tools for mind mapping and dual coding theory activities. These build visual literacy without breaking the budget, and you can scale up only after you see what actually gets used.
Differentiating for Mixed Learning Styles
Choice Boards work. For every major assignment, offer three paths:
Create an infographic
Record a podcast
Perform a skit
Let students pick their modality. This respects that your class contains mixed preferences while still making visual options available to those who need them.
Here's where teachers mess up: don't force everyone to use visual methods. I once made all my students complete mind maps for a history unit. The auditory learners suffered, and I wasted a week. Provide the menu, teach kids to notice what actually helps them learn, then let them self-select based on the content demands. Position graphic organizers and video summaries as optional scaffolds within Universal Design for Learning. They're available, not mandatory. This approach to supporting differentiated instruction ensures visual learning remains a support, not a barrier, and prevents the visual clutter that comes from forcing every child to produce the same visual artifact.

Final Thoughts on Visual Learning
You don't need to redraw your entire curriculum. The teachers who see real results with visual learning pick one strategy and use it until it becomes automatic. Maybe that's a consistent graphic organizer for compare-and-contrast essays. Maybe it's a single anchor chart you reference for three weeks straight instead of making a new one daily. Consistency beats novelty every time. Your students need to see you actually use the tool before they trust it enough to use it themselves.
Start tomorrow. Choose one lesson this week where students typically get stuck — the water cycle, long division, whatever makes them glaze over. Replace five minutes of your verbal explanation with a simple sketch, a labeled diagram, or a visual timeline. Watch what happens when you stop talking and let their eyes do the work.
That shift — from telling to showing — is the only implementation plan you need right now. You already know the content. Now let them see it.

What Is Visual Learning?
Visual learning is a modality where learners process, retain, and recall information most effectively through visual stimuli such as images, diagrams, color coding, and spatial relationships. Research suggests approximately 65% of learners demonstrate strength in visual processing, utilizing the brain's visual cortex to create mental pictures that anchor abstract concepts and improve long-term retention. When you define visual learner in classroom terms, you're describing students who think in pictures and need to see it to believe it.
Defining the Visual Learning Style
To understand the visual learner meaning fully, look to Neil Flemming's 1987 VARK framework. These students prefer "graphic depictions"—charts, graphs, maps, and diagrams—over written or spoken words alone. They rely on spatial reasoning to organize information, using visual literacy skills to decode infographics and visual metaphors that others might miss. When you present a timeline as a flowchart rather than a paragraph, these students light up with recognition.
But preference differs from ability. While a learning style visual learner gravitates toward mind mapping and graphic organizers, rigid labeling limits kids. The research on evidence-based best practices for learning styles suggests we match presentation to content demands, not trap students in fixed categories. Sometimes the content requires listening to tone; sometimes it demands a diagram showing relationships. Your job is knowing which tool serves the learning objective best, not catering to a mythic single style.
Key Characteristics of Visual Learners
You can identify visual processors through specific, observable behaviors:
Doodling while listening to maintain focus, not to ignore you.
Reading facial expressions and body language with startling accuracy.
Requesting written instructions after you've given verbal directions twice.
Color-coding notes spontaneously without being asked.
Remembering exactly where information lived on a page—"upper left corner, blue ink."
Watch a 3rd grader retell a story by drawing comic strip panels instead of writing paragraphs. The pictures carry the narrative weight, showing sequence through boxes and arrows. Or observe a 9th grader during a biology lecture whose Cornell notes contain more diagrams than words, using mind mapping to trace protein synthesis through branching visuals. These students aren't avoiding writing or being difficult; they're translating abstract concepts into concrete visual language they can actually manipulate in working memory.
Visual vs. Auditory and Kinesthetic Processing
Most students aren't pure types. They process through multiple channels, though typically showing roughly 40% visual primary, 30% auditory, 30% kinesthetic in mixed profiles. Here's how the modalities look during actual instruction:
Visual | Auditory | Kinesthetic |
Observing a teacher demonstration silently | Participating in a Socratic seminar | Building a physical model or role-playing |
Visual learners construct the steps in their mind's eye while watching you work through the problem. Auditory learners need the debate and verbal processing to make meaning stick. Kinesthetic learners must handle the materials or move through the concept physically. The student who draws diagrams while listening and then builds the model? They're engaging dual coding theory, using multiple channels to anchor learning deeply rather than relying on a single pathway.
Why Does Visual Learning Matter in Modern Classrooms?
Visual learning matters because cognitive science demonstrates that dual coding—combining visual and verbal information—creates multiple retrieval pathways in long-term memory. In modern classrooms with diverse learners and information density, visual strategies reduce cognitive load while increasing retention rates compared to auditory-only instruction, making content accessible across language barriers and learning differences. You see this when a student who can't explain a concept verbally points to a diagram and gets it exactly right.
The Cognitive Science Behind Visual Retention
Allan Paivio figured this out back in 1971 with his dual coding theory. Your brain processes words through one channel and images through another. When you present information both ways simultaneously, you build two separate retrieval paths instead of one. It’s like having a backup key to the same room.
John Hattie’s Visible Learning research backs this up with hard numbers. Visual representation of concepts shows an effect size around 0.50 to 0.60. That puts it in the medium-to-high impact range—better than most instructional strategies you’re probably using daily. You’re not just making lessons prettier; you’re making them stickier.
I saw this last year with my 7th graders during our Civil War unit. Half the classes got animated digital maps showing troop movements while I narrated the Battle of Gettysburg. The other half got my lecture with no visuals. After one week, the map group could reconstruct the battle sequence with 40% more accuracy. They weren’t smarter; they had spatial reasoning hooks to hang the facts on. This connects directly to information processing theory—your working memory can only hold so much, but visuals chunk the data into manageable pieces. When you overload the verbal channel alone, stuff falls out. Pair it with an image, and you free up space for deeper thinking.
Visual Learning Across Grade Levels
Visual learning looks different depending on the age of your kids. You’re matching tools to developmental stages, moving from concrete images toward abstract symbolic reasoning as students mature.
K–2 (Concrete Operational): Picture schedules and rebus charts for daily routines. Kids who can't read can still see that recess comes after math.
3–5 (Transitioning): Anchor charts with icons and simple graphic organizers. These bridge concrete pictures and the abstract thinking that's coming.
6–8 (Late Concrete/Early Formal): Student-created infographics and sketchnoting. My 8th graders use mind mapping to connect causes and effects in science, building visual literacy while they organize content.
9–12 (Formal Operational): Concept mapping software and scientific diagramming protocols. They're ready for abstract reasoning, but the visual scaffold still helps them see relationships instead of just memorizing terms.
This progression matters for your English Language Learners too. A newcomer who speaks zero English can follow a visual schedule or interpret a graphic organizer on day one. Visuals bypass language barriers. Whether you're teaching examples of visual learning through timelines in history or geometry proofs in math, you're giving every student—not just those with a visual learning style—multiple ways to grasp the content.
How Does Visual Learning Work?
Visual learning works through the brain's dual coding system, where the visual cortex processes imagery simultaneously with verbal processing in separate but interconnected channels. This parallel processing allows learners to chunk information into manageable visual schemas, bypassing working memory limitations while activating spatial reasoning networks that transform abstract data into concrete mental models. When you understand these mechanics, you stop treating images as decorations and start using them as cognitive scaffolding.
Dual Coding Theory and Visual Processing
Allan Paivio's dual coding theory explains why your students remember the diagram better than your lecture. The brain stores verbal input as logogens—sound-based meaning units—in one system, and visual input as imagens—mental pictures—in another. These systems connect through referential links that strengthen memory traces. When you teach photosynthesis to 6th graders using a labeled diagram while explaining aloud, you create two distinct memory traces in two different brain locations, increasing retrieval probability by approximately half compared to verbal-only instruction.
Here's the classroom application. You project a cross-section of a leaf. You point to the stomata and say, "These pores handle gas exchange." The student stores "stomata" verbally and the pore image visually. Later, during the test, they have two retrieval paths instead of one. That's why simply reading about photosynthesis rarely sticks the way sketching and labeling a diagram does.
Visual learner characteristics often show up as doodling—not distraction, but active building of imagen traces. Channel this impulse. Ask students to sketch graphic organizers while you explain cause-and-effect relationships. The sketchpad reinforces the story you're telling.
The Role of Working Memory in Visual Learning
Miller's Law haunts every lesson plan. George Miller discovered that working memory holds roughly 7±2 chunks of information at once. Exceed that, and facts drop out. This is why students glaze over when you present twelve Civil War facts simultaneously. Visual learning offers an escape route through chunking.
Instead of juggling twelve discrete facts, group them into three or four visual categories. When teaching westward expansion, display a historical map with color-coded zones—blue for treaty acquisitions, red for annexation, green for purchase. Suddenly twelve data points become three visual chunks. The brain processes the color pattern as one unit.
Use PowerPoint's Selection Pane to reveal complex diagrams in stages. Show three elements, discuss them, then reveal the next layer. Never dump a diagram with twenty labels on screen at once. You're not simplifying content—you're respecting how memory works in the learning process. When you control the visual flow, you control the cognitive load.
Visual-Spatial Reasoning Pathways
Spatial reasoning is the brain's ability to mentally rotate, manipulate, and transform images. Psychologists measure this with Wechsler subtests like Block Design and Matrix Reasoning. In your classroom, it's the difference between a student who can mentally fold a net into a cube and one who can't. This isn't just geometry—it's the foundation of visual literacy.
Subject-specific applications make abstract concepts concrete:
4th grade mathematics: Use base-ten blocks to visualize regrouping algorithms. Students physically exchange ten ones for one ten, watching the spatial relationship between place values.
10th grade chemistry: Ball-and-stick molecular models let students rotate structures to predict bond angles and polarity. They feel the 109.5-degree tetrahedral angle rather than memorizing the number.
Middle school geography: Mental map rotation exercises strengthen neural pathways. Flip a U.S. map upside down and ask students to identify states, forcing mental manipulation rather than rote memorization of "Florida is in the bottom right."
For older students, mind mapping turns linear notes into spatial networks. An infographic replaces paragraphs of statistics with a visual story that leverages these same pathways. The goal isn't decoration—it's giving the brain a concrete object to manipulate mentally.
Visual Learning Strategies for K-12 Instruction
You need concrete tools, not theory. Here are four visual learning strategies that work in real classrooms, with the prep times and material costs you need to know before Monday morning. Each strategy includes specific grade recommendations and failure modes I’ve encountered during actual instruction.
Graphic Organizers and Visual Note-Taking
Graphic organizers force spatial reasoning onto abstract concepts. They work because they limit working memory by externalizing relationships. Each template below requires roughly 10 minutes to model initially, then students run them independently.
Frayer Model (grades 3-12): Use quarter-page per vocabulary term with four quadrants—definition, characteristics, examples, non-examples. Paper cost is negligible; just cut standard copy paper into quarters. Best for ELA and content-area vocabulary acquisition. I use these during word study stations.
Venn Diagram (K-12): Draw two overlapping circles on 8.5x11 paper. For K-2, trace hula hoops on chart paper first so students physically step into the intersection before drawing independently. Prep time: 2 minutes. Works across all subjects for compare/contrast tasks, especially effective for analyzing characters in literature or historical events.
Thinking Maps (K-12): These cover eight cognitive patterns including cause-effect and sequencing. Elementary students need 11x17 paper minimum—their handwriting requires space. Cost: $15 for a 100-sheet pack. I’ve seen too many 3rd graders cram words into letter-size sheets and lose the visual structure entirely.
Cornell Notes with visual right-hand column (grades 6-12): Replace the summary lines with student-generated sketches. One of my 8th graders drew a cell membrane as a security checkpoint to remember selective permeability. That image stuck better than any written definition. Modify existing templates; zero cost.
For visual note-taking, teach Mike Rohde’s sketchnoting system. Five elements only: containers (bubbles or boxes), connectors (arrows/lines), simple icons (stick figures are acceptable), text (key words only), and shading (for depth cues). Practice once with a five-minute TED Talk clip before asking students to try it during direct instruction. This builds mind mapping skills without artistic pressure.
Color Coding and Visual Hierarchy Systems
The 4-color pen method creates instant dual coding theory associations: black for main notes, blue for questions that arise during reading, red for definitions and vocabulary, green for connections to prior knowledge. Cost: $2 per pen, reusable all year. Students process the color meaning faster than semantic labels alone.
Critical failure mode: approximately 8% of male students and 0.5% of female students have color vision deficiency, with red-green confusion being most common. I learned this the hard way when a 5th grader spent ten minutes searching for the “red section” of his notes. Provide these accessibility alternatives immediately:
Pattern coding: Striped highlighters versus solid fills
Shape symbols: Circles versus squares marked in pencil alongside colors
Texture differentiation: Dotted underlining versus solid lines
For wall displays, maintain visual hierarchy standards: minimum 24-point font for visibility from 20 feet, and 4.5:1 contrast ratio between text and background combinations. That pale yellow paper with orange marker you love? It fails both tests. Use black on white or white on dark blue to ensure true visual literacy accessibility for all learners.
Anchor Charts and Classroom Visual References
Anchor charts work only when co-constructed with students during the lesson, not displayed as pre-made commercial posters. Specifications: 24x36 inch poster paper placed at 42-48 inches from the floor (student eye level). Material cost: $25 for 50 sheets. The process of building them together creates ownership; students reference them because they remember making them.
Three functional types serve distinct purposes:
Procedural: Step-by-step algorithms like long division or lab safety sequences
Strategy: Mnemonic devices like CUBES for math problem-solving or RACES for constructed response writing
Content: Vocabulary webs or scientific classification systems that organize domain knowledge
Implement a “fade strategy” after three to four weeks. Retire charts to prevent visual clutter, photographing them before removal for digital archive access. Students retrieve these examples of visual learning on tablets when needed. This keeps walls current without losing resources, and prevents the wallpaper effect where students stop seeing static displays entirely.
Digital Visualization and Multimedia Tools
Digital tools expand learning strategies for visual learners beyond paper limitations. Four options with honest pricing and device requirements:
Canva for Education: Free, COPPA/FERPA compliant, runs smoothly on Chromebooks. Students build infographics and digital posters without account headaches. Prep time: 15 minutes to set up templates.
Padlet: Free tier allows three boards; paid version runs $10 monthly for unlimited. Tablet-compatible for stylus drawing. Excellent for integrating interactive whiteboards during collaborative brainstorming sessions.
Google Drawings: Free with Workspace. Real-time collaborative diagramming works on any device with a browser. I use this for group word webs during vocabulary instruction.
Desmos: Free graphing calculator with visual regression displays, essential for helping visual learners see mathematical relationships rather than just calculating them.
Apply Mayer’s Cognitive Theory of Multimedia Learning when using these tools. Avoid the split attention effect: place digital text physically integrated with relevant graphics, not separated on different screen areas. Never read slide text verbatim while displaying it—this redundancy effect increases cognitive load because students process identical information through both visual and auditory channels simultaneously, defeating the purpose of visual learning. For immersive VR and AR learning environments, these same principles apply: spatial reasoning requires clear visual hierarchy without competing text overlays.
How Can Teachers Support Study Skills for Visual Learners?
Teachers support visual learners by explicitly teaching visual study techniques including concept mapping with tools like CMAP, spatial memory palaces for sequential information, and color-coded organizational systems. Providing graphic organizers for note-taking, visual timers for time management, and diagram-based study guides allows students to use their visual learning strengths independently. These study skills for visual learners build metacognitive awareness so students stop highlighting entire textbook pages and start creating meaningful mental pictures.
Before adopting new tools, audit your current instruction:
Do students convert linear notes into visual formats before tests?
Can they use classroom space to memorize ordered information?
Do they see time passing, or only hear bells ringing?
Visual Study Guides and Concept Mapping
Concept mapping turns linear notes into spatial relationships that stick. I teach students to pull 3-5 main ideas from a textbook passage and arrange them as branches on a map, with 2-3 supporting details hanging off each branch. When the hierarchy looks right, they do the 'look away' test: cover the map, wait sixty seconds, then redraw it from memory. If they can recreate the structure, they understand the relationships; if not, they missed a connection and need to simplify.
For tools, CMAP Tools offers free desktop software that works well for grades 6-12, though the interface looks dated. Lucidchart runs $7.95 per month for education pricing and syncs across devices, which helps when students work in pairs. If you want paper-based options, use a three-column layout: Question in the left column, Visual Representation in the center, and Explanation in the right. This aligns with dual coding theory by forcing students to translate words into images and back again. You can also point students toward visual note-taking strategies for additional mind mapping methods that work on tablets or in notebooks. The key is teaching them that graphic organizers aren't just worksheets to fill in—they're study tools to create from scratch.
Spatial Memory Techniques and Memory Palaces
Memory palaces exploit the brain's natural strength for spatial reasoning. I guide students to pick 5-7 fixed locations in our classroom—door, whiteboard, teacher desk, pencil sharpener, bookshelf, clock, window—and assign each spot a piece of sequential information. For example, when memorizing the seven steps of the scientific method, 'hypothesis' goes at the door, 'experiment' at the whiteboard, 'data collection' at the teacher desk, and so on. When they need to recall the sequence during a test, they mentally walk the room rather than reread a list.
This technique works because spatial recall activates the hippocampus, creating location-based retrieval cues that outlast simple repetition. I've seen students remember twenty-item sequences weeks after we practiced them, simply because they can still picture where 'conclusion' lives on the bookshelf. Start with five items max until the habit forms. For visual learners who struggle with arbitrary order, anchoring information to physical space turns abstract sequences into concrete mental infographics they can tour at will. Practice this once a week with vocabulary lists or historical timelines to build automaticity.
Visual Scheduling and Time Management Tools
Visual scheduling supports executive function by making time visible rather than abstract. In elementary grades, I use First/Then boards made from laminated file folders with velcro icons showing the current task and the upcoming reward. Middle schoolers get block schedule templates where they color-code subjects with highlighters—blue for math, yellow for English—so they can see the day's rhythm at a glance. High schoolers often prefer Google Calendar with emoji icons representing different activities; the visual punch of a basketball emoji for practice or a book for study hall triggers recognition faster than text alone.
For time awareness, the Time Timer clock ($40) shows a red disk disappearing as minutes pass, which helps students sense duration without reading numbers. Younger kids who can't read analog clocks use sand timers for short bursts. For independent study sessions, the Pomodoro technique with printable tomato tracker sheets creates a visual rhythm of 25-minute work blocks and 5-minute breaks. These tools pair well with digital flashcards and spaced repetition to build complete visual literacy around personal organization and studying methods for visual learners. When students can see their time, they stop asking "how much longer?" and start managing themselves.
Getting Started: Implementing Visual Learning in Your Classroom
Auditing Your Current Visual Environment
Before you buy anything, look at what you already have. Walk to the back row of your classroom and try to read your wall displays. If you can't make out the text from there, your students can't either. Use this quick audit checklist:
Font size: Minimum 24pt for wall displays visible from the back row
Contrast ratio: 4.5:1 minimum for text/background (use WebAIM contrast checker)
Visual clutter: No more than 20% of wall space covered to prevent cognitive overload
Sight line testing: Use your smartphone camera from a student desk perspective; if text is blurry in the photo, it's too small
Rate your current classroom on a Visual Environment Rubric using a 1-4 scale across categories of readability, organization, relevance, and accessibility. This audit takes twenty minutes and saves you from building effective classroom design and learning zones on a broken foundation.
Low-Cost Visual Tools to Start With
You don't need a district grant to start. Build a class-wide starter kit for under $50:
Sheet protectors ($15 for 50) with dry erase markers ($20 for class set of 25) for reusable graphic organizers
Post-it Super Sticky Easel Pads ($25 for 4 pads) for temporary anchor charts
Colored masking tape ($3/roll) for floor number lines and spatial reasoning activities
For individual supplies, stay under $2 per student: a 4-color retractable pen ($1.25), a highlighter set with distinct shapes for accessibility ($0.75), and a small whiteboard ($1 at dollar stores). Slide blank templates into the sheet protectors and you've got reusable tools for mind mapping and dual coding theory activities. These build visual literacy without breaking the budget, and you can scale up only after you see what actually gets used.
Differentiating for Mixed Learning Styles
Choice Boards work. For every major assignment, offer three paths:
Create an infographic
Record a podcast
Perform a skit
Let students pick their modality. This respects that your class contains mixed preferences while still making visual options available to those who need them.
Here's where teachers mess up: don't force everyone to use visual methods. I once made all my students complete mind maps for a history unit. The auditory learners suffered, and I wasted a week. Provide the menu, teach kids to notice what actually helps them learn, then let them self-select based on the content demands. Position graphic organizers and video summaries as optional scaffolds within Universal Design for Learning. They're available, not mandatory. This approach to supporting differentiated instruction ensures visual learning remains a support, not a barrier, and prevents the visual clutter that comes from forcing every child to produce the same visual artifact.
Final Thoughts on Visual Learning
You don't need to redraw your entire curriculum. The teachers who see real results with visual learning pick one strategy and use it until it becomes automatic. Maybe that's a consistent graphic organizer for compare-and-contrast essays. Maybe it's a single anchor chart you reference for three weeks straight instead of making a new one daily. Consistency beats novelty every time. Your students need to see you actually use the tool before they trust it enough to use it themselves.
Start tomorrow. Choose one lesson this week where students typically get stuck — the water cycle, long division, whatever makes them glaze over. Replace five minutes of your verbal explanation with a simple sketch, a labeled diagram, or a visual timeline. Watch what happens when you stop talking and let their eyes do the work.
That shift — from telling to showing — is the only implementation plan you need right now. You already know the content. Now let them see it.
Still grading everything by hand?
EMStudio is a free teaching management app — manage your classes, students, lessons, and more!
Learn More
Still grading everything by hand?
EMStudio is a free teaching management app — manage your classes, students, lessons, and more!
Learn More


Notion4Teachers
Notion templates to simplify administrative tasks and enhance your teaching experience.


2026 Notion4Teachers. All Rights Reserved.
Notion4Teachers
Notion templates to simplify administrative tasks and enhance your teaching experience.
2026 Notion4Teachers. All Rights Reserved.
Notion4Teachers
Notion templates to simplify administrative tasks and enhance your teaching experience.
2026 Notion4Teachers. All Rights Reserved.